

Use R to produce the back-to-back stem-and-leaf display in Figure 3.4stored as Fig3-4.dat. This is a tricky
Question:
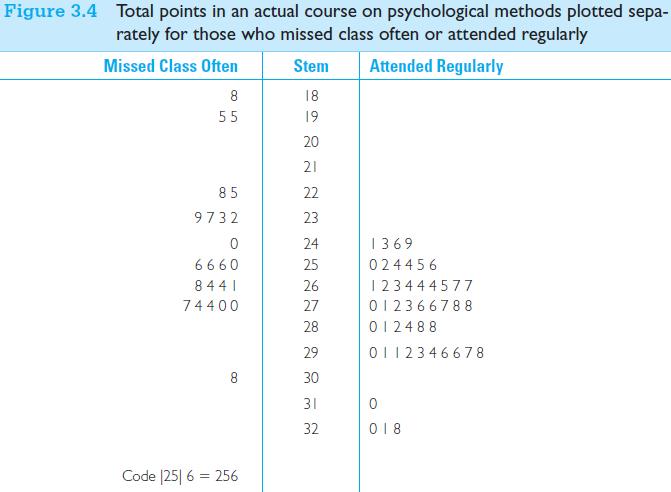
Use R to produce the back-to-back stem-and-leaf display in Figure 3.4—stored as Fig3-4.dat.
This is a tricky one, and it is more of a puzzle to work on. Can you get it to work? I suggest that you look at http://exploredata.wordpress.com/2012/08/28/back-to-back-stemplots/
Ignore his reference to LearnEDA—it no longer exists. Instead, use “install.packages(aplpack)” and then “library(aplpack).” The data file is available at www.uvm
\\.edu/~dhowell/fundamentals9/DataFiles/Fig3-4.dat. The data are tab separated, so use sep 5 “\t”
(The Web page on R for this chapter contains the necessary code for a different data set, but see if you can work it out for yourself. It’s fun when it finally works. The code using the dropbox feature is also there.)
Step by Step Answer:
back...View the full answer


Fundamental Statistics For The Behavioral Sciences
ISBN: 9781305652972
9th Edition
Authors: David C. Howell
