Question:
Why do the data in Exercise 12.6 not really speak to the issue of whether education in North Dakota is generally in good shape?
Exercise 12.6
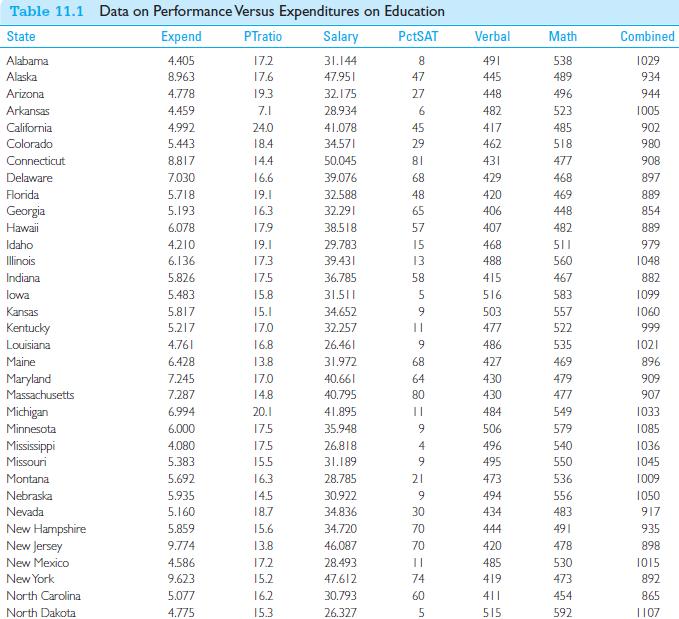
In Table 11.1 in Chapter 11 we saw data on the state means of students who took the SAT exam. The mean Verbal SAT for North Dakota was 515. The standard deviation was not reported. Assume that 238 students took that exam.
a) Is this result consistent with the idea that North Dakota’s students are a random sample from a population of students having a mean of 500 and a standard deviation of 100?
b) From what we learned in Chapter 11 about SAT scores and how, and why, they vary by state, would you feel comfortable concluding that people in North Dakota are smarter than people elsewhere?

Transcribed Image Text:
Table 11.1 Data on Performance Versus Expenditures on Education State Alabama Expend PTratio Salary PctSAT Verbal Math Combined 4.405 17.2 31.144 8 491 538 1029 Alaska 8.963 17.6 47.951 47 445 489 934 Arizona 4.778 19.3 32.175 27 448 496 944 Arkansas 4.459 7.1 28.934 6 482 523 1005 California 4.992 24.0 41.078 45 417 485 902 Colorado 5.443 18.4 34.571 29 462 518 980 Connecticut 8.817 14.4 50.045 81 431 477 908 Delaware 7.030 16.6 39.076 68 429 468 897 Florida 5.718 19.1 32.588 48 420 469 889 Georgia 5.193 16.3 32.291 65 406 448 854 Hawaii 6.078 17.9 38.518 57 407 482 889 Idaho 4.210 19.1 29.783 15 468 511 979 Illinois 6.136 17.3 39.431 13 488 560 1048 Indiana 5.826 17.5 36.785 58 415 467 882 lowa 5.483 15.8 31.511 5 516 583 1099 Kansas 5.817 15.1 34.652 9 503 557 1060 Kentucky 5.217 17.0 32.257 11 477 522 999 Louisiana 4.761 16.8 26.461 9 486 535 1021 Maine 6.428 13.8 31.972 68 427 469 896 Maryland 7.245 17.0 40.661 64 430 479 909 Massachusetts 7.287 14.8 40.795 80 430 477 907 Michigan 6.994 20.1 41.895 || 484 549 1033 Minnesota 6.000 17.5 35.948 9 506 579 1085 Mississippi 4.080 17.5 26.818 4 496 540 1036 Missouri 5.383 15.5 31.189 9 495 550 1045 Montana 5.692 16.3 28.785 21 473 536 1009 Nebraska 5.935 14.5 30.922 9 494 556 1050 Nevada 5.160 18.7 34.836 30 434 483 917 New Hampshire 5.859 15.6 34.720 New Jersey 9.774 13.8 46.087 New Mexico 4.586 17.2 28.493 New York 9.623 15.2 47.612 North Carolina 5.077 16.2 30.793 North Dakota 4.775 15.3 26.327 RR=85 70 444 491 935 70 420 478 898 485 530 1015 74 419 473 892 60 411 454 865 515 592 1107


