

The sand dune curve shown in Figure 2.20b is a depth versus traveltime plot that can be
Question:
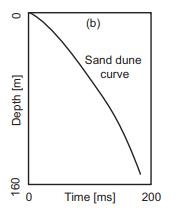
The sand dune curve shown in Figure 2.20b is a depth versus traveltime plot that can be obtained from an uphole or a check shot survey. Derive a 1D velocity function based on the depth versus traveltime plot in Figure 2.20b.
Figure 2.20b
Step by Step Answer:

This question has not been answered yet.
You can Ask your question!
Related Book For 

Question Posted:
