Phase-distribution measurements were made for the PEG 3400 - dextran T40 - water system at (4{ }^{circ}
Question:
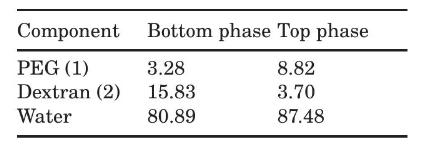
Phase-distribution measurements were made for the PEG 3400 - dextran T40 - water system at \(4{ }^{\circ} \mathrm{C}\) by Diamond and Hsu (1989). The following table gives the equilibrium concentrations of the two resulting phases in one of the tie lines observed, all in wt\%.

Use equation (7-62) to compute the values of \(A_{i}\) for dextran and PEG. Use those values to generate a tie line with one end at \(11.19 \mathrm{wt} \%\) PEG in the top phase.
Data From Equation 7-62:-

Fantastic news! We've Found the answer you've been seeking!
Step by Step Answer:
Related Book For 

Question Posted:


