

High-low method and regression analysis. Happy Business College has recently opened a restaurant as part of its
Question:
High-low method and regression analysis. Happy Business College has recently opened a restaurant as part of its hospitality major. For the first 10 weeks the manager did not estimate any costs, but instead hoped revenues would cover costs. One of the new waiters, who happens to be taking a cost accounting class, suggests that the manager take the past known weekly costs and try to determine a cost equation by relating the cost to the number of customers served. The cost and customer data are as follows: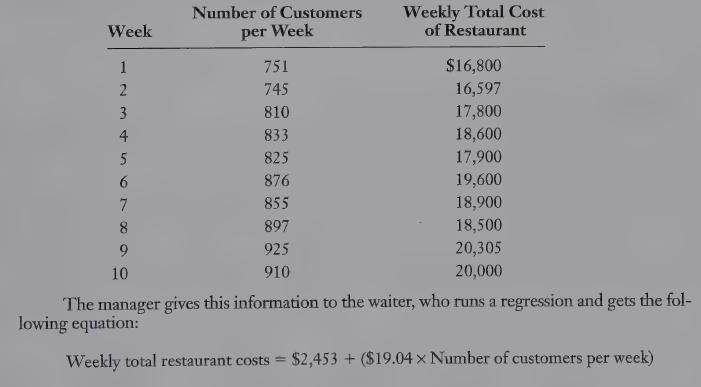
REQUIRED 1. Plot the relationship between number of customers per week and weekly total restaurant costs.
2. Estimate the cost equation using the high-low method, and draw this line on your graph.
3. Draw the regression line on your graph. Use your graph to evaluate the regression line using the criteria of economic plausibility, goodness of fit, and significance of the independent variable. Is the cost function estimated using the high-low method a close approximation to the cost function estimated using the regression method? Explain briefly.
4. At what point (number of customers) will the expected total cost based on the high-low equation equal the expected total cost based on the regression equation?LO1
Step by Step Answer:

This question has not been answered yet.
You can Ask your question!


Cost Accounting A Managerial Emphasis
ISBN: 9780135004937
5th Canadian Edition
Authors: Charles T. Horngren, Foster George, Srikand M. Datar, Maureen P. Gowing
