

1 CLASSROOM SIMULATION: FISH FORWARDERS This is a competitive exercise designed to test players' skills at setting...
Question:
1 CLASSROOM SIMULATION: FISH FORWARDERS This is a competitive exercise designed to test players' skills at setting inventory ordering rules over a 10-week planning horizon. Maximum profit at the end determines the winner. Fish Forwarders supplies fresh shrimp to a variety of customers in the New Orleans area. It orders cases of shrimp from fleet representatives at the beginning of each week to meet a demand from its customers at the mickle of the week. Shrimp are subsequently delivered to Fish Forwarders and then, at the end of the week, to its customers. Both the supply of shrimp and the demand for shrimp are uncertain. The supply may vary as much as 10 percent from the amount ordered, and by contract, Fish Forwarders must purchase this supply. The probability associated with this variation is -10 percent, 30 percent of the time; 0 percent, 50 percent of the time; and +10 percent, 20 percent of the time. Weekly demand for shrimp is normally distributed with a mean of 800 cases and standard deviation of 100 cases. A case of shrimp costs Fish Forwarders $30 and sells for $50. Any shrimp not sold at the end of the week are sold to a cat-food company at $4 per case. Fish Forwarders may, if it chooses, order the shrimp flash-frozen by the supplier at dockside, but this raises the cost of a case by $4 and, hence, costs Fish Forwarders $34 per case. Procedure for play. The game requires that each week a decision be made as to how many cases to order of regular shrimp and of flash-frozen shrimp. The number ordered may be any amount. The instructor plays the role of referee and supplies the random numbers. The steps in playing the game are as follows:
a. Decide on the order amount of regular shrimp or flash-frozen shrimp and enter the figures in column 3 of the worksheet. (See Exhibit TN17.12.) Assume that there is no opening inventory of flash-frozen shrimp.
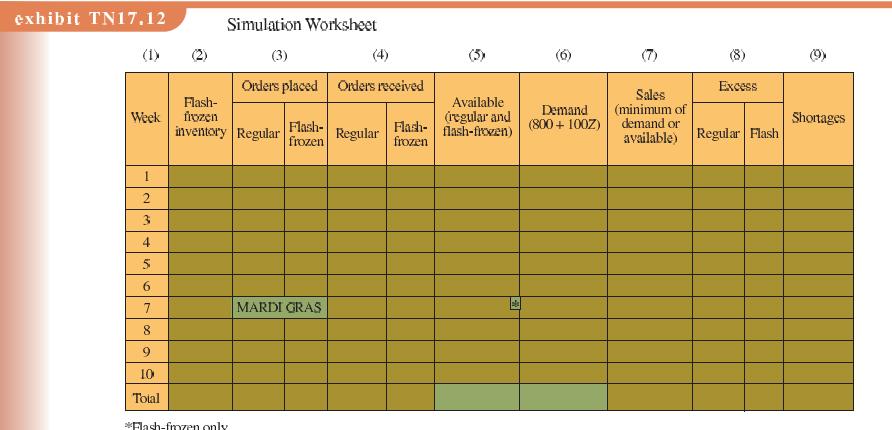
b. Determine the amount that arrives and enter it under "Orders received." To accomplish this, the referee draws a random number from a uniform random number table (such as that in Appendix B) and finds its associated level of variation from the following random number intervals: 00 to 29=-10 percent, 30 to 79=0 percent, and 80 to 99+10 percent. If the random number is, say, 13, the amount of variation will be -10 percent. Thus, if you decide to order 1,000 regular cases of shrimp and 100 flash-frozen cases, the amount you would actually receive would be 1,000 - 0.10(1,000), or 900 regular cases, and 100 -0.10(100), or 90 flash-frozen cases. (Note that the variation is the same for both regular and flash-frozen shrimp.) These amounts are then entered in column 4.
c. Add the amount of flash-frozen shrimp in inventory (if any) to the quantity of regular and flash-frozen shrimp just received and enter this amount in column 5. This would be 900, using the figures provided earlier.
d. Determine the demand for shrimp. To accomplish this, the referee draws a random normal devi- ate value from Exhibit TN17.3 or Appendix C and enters it into the equation at the top of col- umn. 6. Thus, if the deviate value is -1.76, demand for the week is 800+ 100(-1.76), or 624.
e. Determine the amount sold. This will be the lesser of the amount demanded (column 6) and the amount available (column 5). Thus, if a player has received 990 and demand is 624, the quantity entered will be 624 (with 990-624, or 366 left over).
f. Determine the excess. The amount of excess is simply that quantity remaining after demand for a given week is filled. Always assume that regular shrimp are sold before the flash-frozen. Thus, if we use the 366 figure obtained in
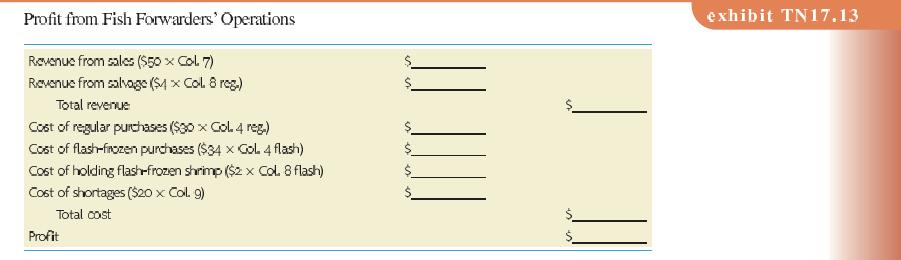
e, the excess would include all the original 90 cases of flash-frozen shrimp. g. Determine shortages. This is simply the amount of unsatisfied demand each period, and it occurs only when demand is greater than sales. (Because all customers use the shrimp within the week in which they are delivered, backorders are not relevant.) The amount of shortage (in cases of shrimp) is entered in column 9. Profit determination. Exhibit TN17.13 is provided for determining the profit achieved at the end of play. The values to be entered in the table are obtained by summing the relevant columns of Exhibit TN17.12 and making the calculations.
Assignment. Simulate operations for a total of 10 weeks. It is suggested that a 10-minute break be taken at the end of Week 5, allowing the players to evaluate how they may improve their per- formance. They might also wish to plan an ordering strategy for the week of Mardi Gras, when no shrimp will be supplied.
Step by Step Answer:


Operations Management For Competitive Advantage
ISBN: 1572
11th Edition
Authors: Richard B. Chase, F. Robert Jacobs
