(a) Using data from Appendix 6, plot a graph to show how the ionic radii of high-spin,...
Question:
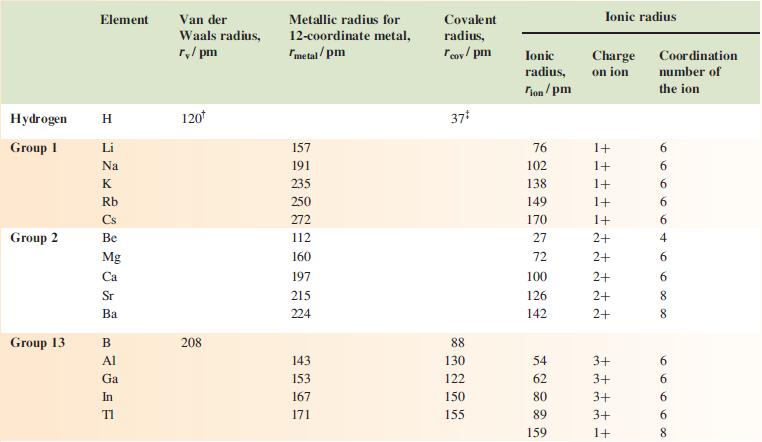
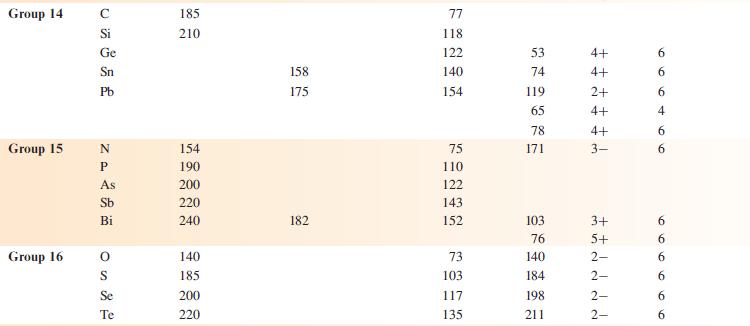
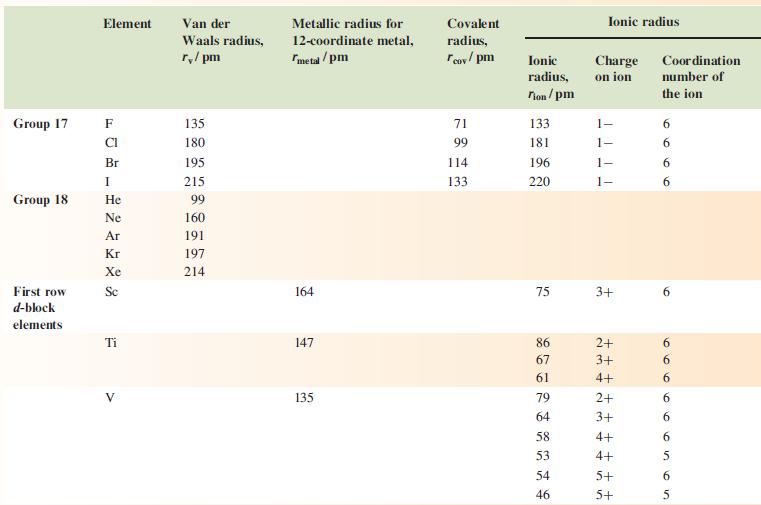
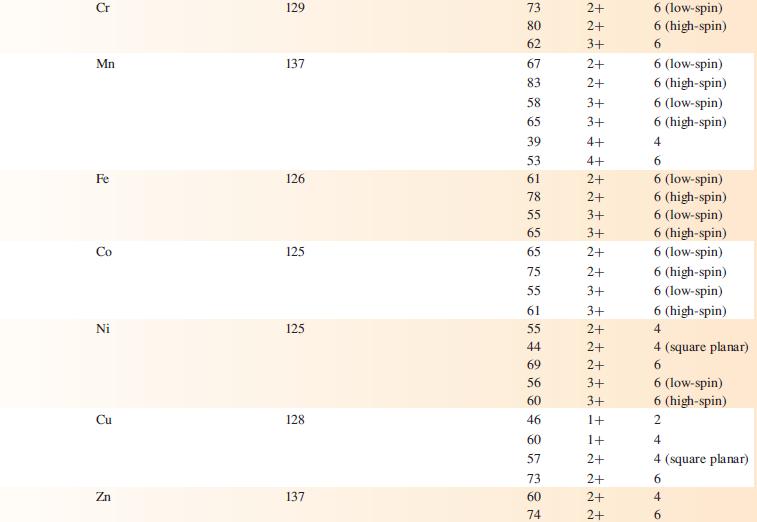
(a) Using data from Appendix 6, plot a graph to show how the ionic radii of high-spin, 6-coordinate M2+ ions of the first row of the d-block vary with the dn configuration. Comment on factors that contribute to the observed trend.
(b) Briefly discuss other properties of these metal ions that show related trends.
Data from appendix 6.


Fantastic news! We've Found the answer you've been seeking!
Step by Step Answer:
Related Book For 

Question Posted:


