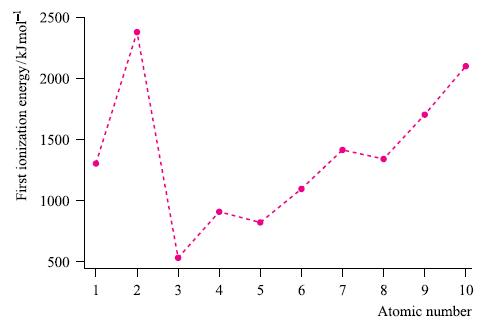
Figure 1.17 shows the values of IE 1 for the first 10 elements. (a) Label each point
Question:
Figure 1.17 shows the values of IE1 for the first 10 elements.
(a) Label each point with the symbol of the appropriate element.
(b) Give detailed reasons for the observed trend in values.
Figure 1.17.
Fantastic news! We've Found the answer you've been seeking!
Step by Step Answer:
Related Book For 

Question Posted:


