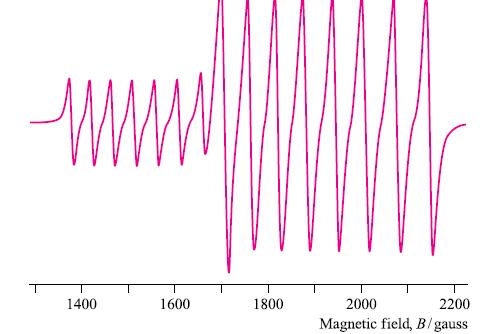
Figure 4.43 shows the 9.214GHz EPR spectrum arising from the two sites of Co 2+ ( 59
Question:
Figure 4.43 shows the 9.214GHz EPR spectrum arising from the two sites of Co2+ (59Co, 100% abundant, I = 7/2) doped into magnesium acetate. The sites differ slightly in their effective hyperfine coupling constants, and more significantly in their g-values.
(a) Calculate the g-values for the two sites.
(b) Explain why the central peak is more intense than the peaks appearing at higher magnetic field.
(c) What would happen if the differences in g-values of the two sites is smaller than is observed in Fig. 4.43?
Figure 4.43

Fantastic news! We've Found the answer you've been seeking!
Step by Step Answer:
Related Book For 

Question Posted:


