

Question: The graph in Figure 1.38 shows the distance versus time for an elevator as it moves up and down in a building. Compute the elevators
The graph inFigure 1.38 shows the distance versus time for an elevator as it moves up and down in a building.
Compute the elevator€™s velocity at the times marked a, b, and c.
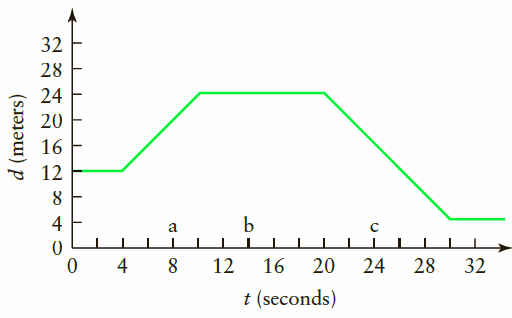
32 28 24 20 16 12 a 28 32 4 12 16 20 24 t (seconds) d (meters)
Step by Step Solution
★★★★★
3.39 Rating (177 Votes )
There are 3 Steps involved in it
1 Expert Approved Answer
Step: 1 Unlock

Compute the elevators veloci... View full answer
Question Has Been Solved by an Expert!
Get step-by-step solutions from verified subject matter experts
Step: 2 Unlock
Step: 3 Unlock