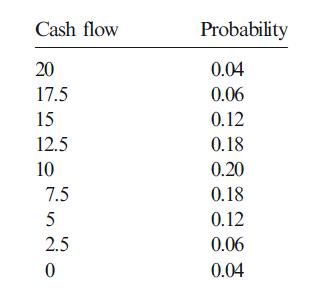
The following table lists different cash flows that management believes a project might earn in the fifth
Question:
The following table lists different cash flows that management believes a project might earn in the fifth year of its life. Listed also in the table is management’s estimate of the probability associated with each of the alternative possible cash flows the project might generate in that year.

(a) What is the expected cash flow in Year 5?
(b) Each of the possible cash flows is different from the expected cash flow. If we square each of the differences from the expected cash flow and calculate the probability-weighted average of these squared differences, we obtain the variance of the cash flow. Calculate the variance of the Year 5 cash flow.
(c) The standard deviation is the square root of the variance. Calculate the standard deviation of the Year 5 cash flow.
Step by Step Answer:


