

Question: Test scores from a large calculus class of 400 are shown in the histogram below. a) Describe the distribution of scores. What might account for
Test scores from a large calculus class of 400 are shown in the histogram below.
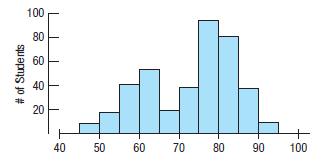
a) Describe the distribution of scores. What might account for this shape?
b) Why might both the mean and median score be misleading as a summary of the center?
# of Students 100 80 60 40 20 40 50 60 70 80 90 100
Step by Step Solution
★★★★★
3.48 Rating (168 Votes )
There are 3 Steps involved in it
1 Expert Approved Answer
Step: 1 Unlock

a The distribution of Calculus test scores is bimodal with one mode at about 62 and one at a... View full answer
Question Has Been Solved by an Expert!
Get step-by-step solutions from verified subject matter experts
Step: 2 Unlock
Step: 3 Unlock