

Question: Consider the free-sliding beam shown in Fig. P8.4a. Direct and cross FRFs were measured at six locations and the imaginary parts are provided for the
Consider the free-sliding beam shown in Fig. P8.4a. Direct and cross FRFs were measured at six locations and the imaginary parts are provided for the frequency interval near its second bending natural frequency of \(350 \mathrm{~Hz}\) in Figs. P8.4b-P8.4g. Given the FRF data, sketch the mode shape corresponding to the second natural
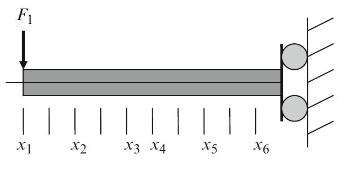 Fig. P8.4a Free-sliding beam model.
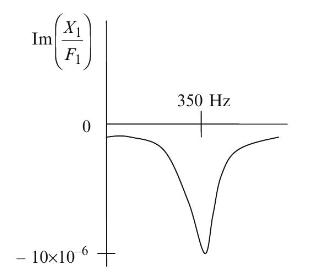
Fig. P8.4b Direct FRF \(\frac{X_{1}}{F_{1}}\) for the free-sliding beam.
frequency. Normalize the mode shape to a value of 1 at the free end.
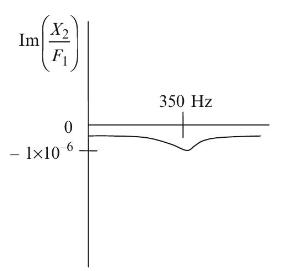
Fig. P8.4c Cross FRF \(\frac{X_{2}}{F_{1}}\) for the free-sliding beam.
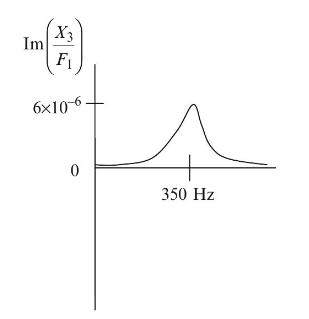
Fig. P8.4d Cross FRF \(\frac{X_{3}}{F_{1}}\) for the free-sliding beam.
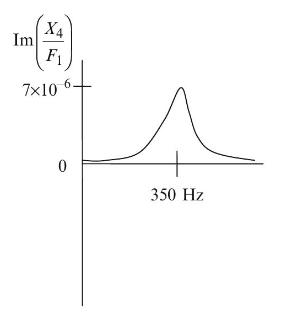
Fig. P8.4e Cross FRF \(\frac{X_{4}}{F_{1}}\) for the free-sliding beam.
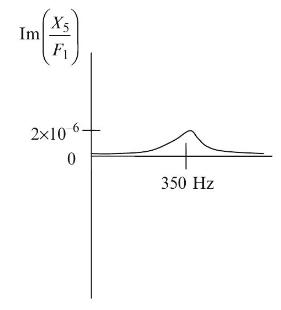
Fig. P8.4f Cross FRF \(\frac{X_{5}}{F_{1}}\) for the free-sliding beam.
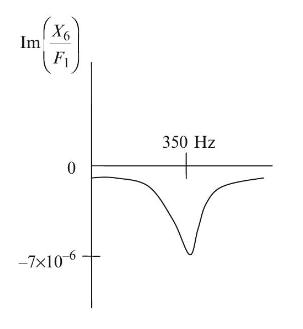
Fig. P8.4g Cross FRF \(\frac{X_{6}}{F_{1}}\) for the free-sliding beam.
Fi | | | | | | | | x1 X2 X3 X4 X5 X6
Step by Step Solution
3.55 Rating (162 Votes )
There are 3 Steps involved in it

Get step-by-step solutions from verified subject matter experts