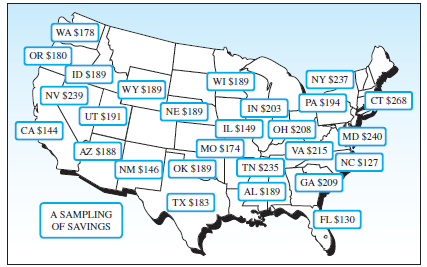
An advertisement in a recent Time magazine claimed that Geico Insurance will help you save an average
Question:

a. Construct a relative frequency histogram to describe the average savings for the 27 states shown on the United States map. Do you see any unusual features in the histogram?
b. Construct a stem and leaf plot for the data provided by Geico Insurance.
c. How do you think that Geico selected the 27 states for inclusion in this advertisement?
Fantastic news! We've Found the answer you've been seeking!
Step by Step Answer:
Related Book For 

Introduction To Probability And Statistics
ISBN: 9780495389538
13th Edition
Authors: William Mendenhall, Robert J. Beaver, Barbara M. Beaver
Question Posted:


