Question:
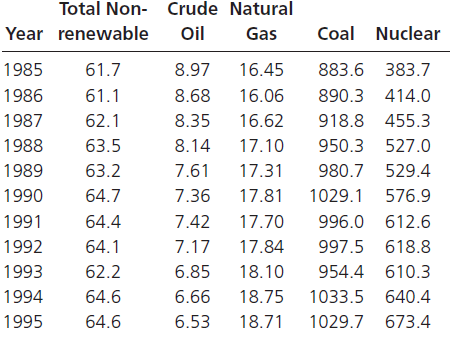
For 1985€“1995, production in the energy sector included the quantities shown here. The variables and their units are total nonrenewable energy production (quadrillion Btu), crude oil (million bbl per day), natural gas (trillion cubic feet), coal (million short tons), and nuclear power (billion kWh). The data are also in file XR17045. For these data, and with y = total nonrenewable energy production, generate the correlation matrix for the independent variables and comment on the possible presence of multicollinearity.

Transcribed Image Text:
Total Non- Crude Natural Oil Year renewable Coal Nuclear Gas 61.7 16.45 1985 8.97 883.6 383.7 890.3 414.0 1986 61.1 8.68 16.06 16.62 1987 62.1 8.35 918.8 455.3 8.14 1988 63.5 17.10 950.3 527.0 17.31 1989 63.2 7.61 980.7 529.4 64.7 7.36 17.81 1990 1029.1 576.9 64.4 1991 7.42 17.70 996.0 612.6 64.1 17.84 1992 7.17 997.5 618.8 1993 62.2 6.85 18.10 954.4 610.3 1994 64.6 6.66 18.75 1033.5 640.4 1995 64.6 6.53 18.71 1029.7 673.4


