Question:
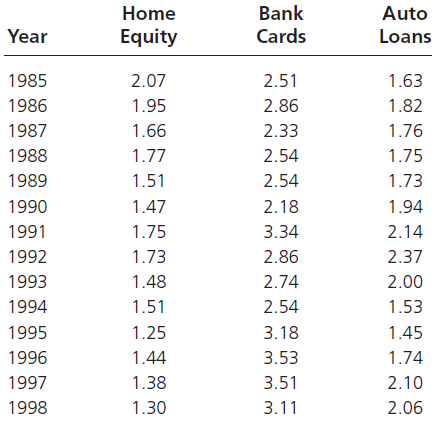
The American Bankers Association has reported the percentage of consumer loans in various categories that were at least 30 days overdue in the first quarter of each of the years shown in the table. The data are listed in file XR17064. For y = percent of home equity loans overdue, x
1= percent of bank credit card balances overdue, and x
2= percent of direct auto loans overdue, fit a first-order polynomial model to the data and interpret the partial regression coefficients and the R
2value. Add an interaction term to the model. To what extent has the addition of the interaction term improved the explanatory power of the model?

Transcribed Image Text:
Bank Home Auto Cards Equity Year Loans 1985 2.07 2.51 1.63 2.86 1.82 1986 1.95 1.66 1987 2.33 1.76 2.54 1988 1.77 1.75 1989 1.51 2.54 1.73 1990 1.47 2.18 1.94 2.14 1991 1.75 3.34 2.37 1992 1.73 2.86 2.74 1993 1.48 2.00 1994 1.51 2.54 1.53 1.25 1995 3.18 1.45 1996 1.44 3.53 1.74 1997 1.38 3.51 2.10 1998 1.30 3.11 2.06


