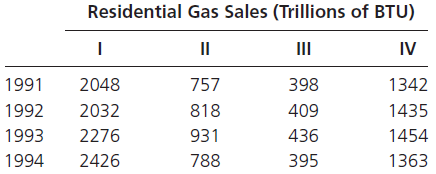
The following data describe quarterly residential natural gas sales from 1991 through 1994. Determine the quarterly seasonal
Question:

Transcribed Image Text:
Residential Gas Sales (Trillions of BTU) II IV 1991 1992 1993 2048 2032 2276 757 398 409 436 1342 1435 1454 818 931 788 1363 1994 2426 395
Fantastic news! We've Found the answer you've been seeking!
Step by Step Answer:
Answer rating: 50% (16 reviews)
For this seasonal index problem involving quarterly data we will use Excel worksheet template tmquar...View the full answer

Answered By

Muqadas Javed
I am a mentor by profession since seven years. I have been teaching on online forums and in universities. Teaching is my passion therefore i always try to find simple solution for complicated problems or task grasp them so that students can easily grasp them.I will provide you very detailed and self explanatory answers and that will help you to get good grade. I have two slogans: quality solution and on time delivery.
4.60+
24+ Reviews
144+ Question Solved
Related Book For 

Question Posted:
Students also viewed these Mathematics questions
-
The following data describe quarterly residential natural gas sales from 2005 through 2008. Determine the quarterly seasonal indexes, then use these indexes to deseasonalize the original data....
-
In 2016, the average monthly residential natural gas bill for Black Hills Energy customers in Cheyenne, Wyoming, is $67.95 (Wyoming Public Service Commission website). How is the monthly average gas...
-
The following data describe U.S. motor vehicle travel and fuel consumption from 2002 through 2006. The data represent billions of gallons consumed and billions of miles traveled, respectively. a....
-
Nu Company reported the following pretax data for its first year of operations. Net sales 2,930 Cost of goods available for sale 2,420 Operating expenses 750 Effective tax rate 20 % Ending...
-
The National Science Foundation (NSF) promotes girls' participation in informal science, technology, engineering, and mathematics (STEM) programs. What has been the impact of these informal STEM...
-
Split the class into groups of four to six students and assign each group a health behavior. For example, the behaviors could be smoking, exercise, alcohol, bullying, cancer screening, etc. Have each...
-
Explain the differences between product advertising and institutional advertising and the variations within each type.
-
Southwestern Fashions, Inc. which uses a job-order costing system had two jobs in process at the start of the year: job no. 101 ($168,000) and job no. 102 ($107,000). The following information is...
-
Accounting for bonds question: () treat "A" and "B" independently, and () be careful with your dotes. for this question: (0) on January 1, 2019, ABC Company issued 500 bonds, each with a face value...
-
You are Maria Herrera and have been recently promoted to the position of director of financial analysis for a medium-size consumer goods firm. During your first few weeks on the job, you took the...
-
The following data show U.S. retail sales of canoes from 1980 through 1997, with data in thousands of boats. a. Construct a graph of the time series. Does the overall trend appear to be upward or...
-
The National Association of Railroad Passengers has reported the following data describing U.S. commuter train ridership. Year 1995 1996 1997 1998 1999 2000 Riders 42.2 45.9 48.5 54.0 58.3 61.6...
-
Carolina Company is evaluating a possible \($150,000\) investment in equipment that would increase cash flows from operations for four years. The equipment will have no salvage value. The income tax...
-
For this online discussion, we will explore the relevance of various management styles in the context of your respective organizations. Your task is to review different management styles and propose...
-
Is a t-Distribution Appropriate? A sample with size n = 10 has x = 508.5, and s = 21.5. The dotplot for this sample is given below. 0000 00 500 510 520 530 540 550 560 570 Indicate whether or not it...
-
Interpret the results. Write a statement to summarize your conclusion. Is a relationship present? Do we accept or reject the null hypothesis? Are the two variables related? Why or why not?
-
Case study information Australian Renewable Energy Hub Source: https://research.csiro.au/hyresource/australian-renewable-energy-hub/ April 20th, 2023 The Australian Renewable Energy Hub (AREH) will...
-
Listening is a crucial leadership skill that is essential for building effective relationships and solving problems. Write a paper that explores the importance of listening as a leadership skill,...
-
Selected transactions for Babcock Company during November of the current year are listed in Problem 6-3A. Instructions Journalize the entries to record the transactions of Babcock Company for...
-
Prove the result that the R 2 associated with a restricted least squares estimator is never larger than that associated with the unrestricted least squares estimator. Conclude that imposing...
-
Data to be used in a linear regression analysis involving clients of an investment counselor include information regarding the risk level each client has specified: low, medium, or high. Determine...
-
Repeat Exercise 17.23, but for clients whose risk levels have been specified as low, medium, high, or very high. Repeat exercise Data to be used in a linear regression analysis involving clients of...
-
The manager of an ice cream store has developed a regression equation for estimating the number of customers on the basis of two independent variables: x1 = the high temperature (degrees Fahrenheit)...
-
Discuss American History
-
Your firm has developed a new lithium ion battery polymer that could enhance the performance of lithion ion batteries. These batteries have applications in many markets including cellphones, laptops,...
-
Need help analyzing statistical data 1. ANOVA) True or false: If we assume a 95% confidence level, there is a significant difference in performance generally across all groups. 2. (t-test) True or...

Study smarter with the SolutionInn App


