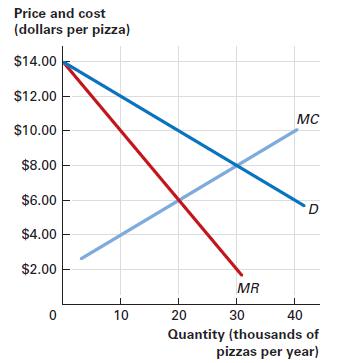
1.5 The figure illustrates the demand at a pizza franchise. Suppose that there are 10,000 customers with...
Question:
1.5 The figure illustrates the demand at a pizza franchise. Suppose that there are 10,000 customers with identical demands. Each customer will visit the pizza shop once a year and buy either one, two, or three pizzas. Each customer is willing to pay some price between $14.00 and $12.00 for the first pizza (so some will pay $13.50, others will pay $12.25, and so on), between
$12.00 and $10.00 for the second pizza, and between $10.00 and $8.00 for the third pizza.

a. If the managers do not price discriminate, what price will they charge, and what quantity will they sell? What does the consumer surplus equal?
b. If the managers price discriminate by charging one price for a customer’s first pizza, a second price for a customer’s second pizza, and a third price for a customer’s third pizza, what will be their profit-maximizing prices? What is the amount of consumer surplus? By how much has the economic profit changed?
Step by Step Answer:


