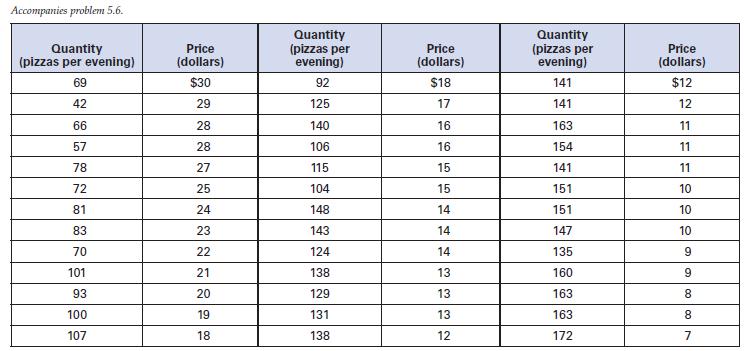
5.6 The table below has data for the price of pizzas and the quantity demanded at each...
Question:
5.6 The table below has data for the price of pizzas and the quantity demanded at each price.
a. Use these data to estimate the demand curve for pizza. You want to report and discuss the estimated coefficients. Are they what you expected? How well does your estimated regression fit the data? Provide a figure if you think it would be useful.
b. Your manager knows that the elasticity of demand can help you make good decisions.
So once you have your demand curve, calculate the elasticity at a price of $10, $15, $20, $25, and $30. Carefully describe how you calculated the elasticity. How does the elasticity change along the demand curve? Using the estimated demand curve, over what price range is the demand elastic? At what price is the demand unit elastic? Over what price range is the demand inelastic?

Step by Step Answer:


