

The graphical presentation of data for cost analysis purposes is an excellent way of starting an analysis.
Question:
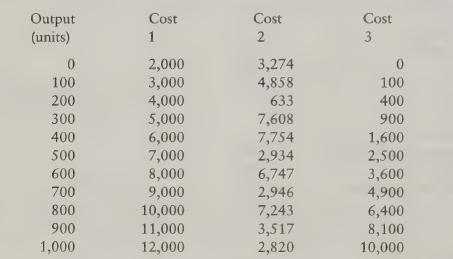
The graphical presentation of data for cost analysis purposes is an excellent way of starting an analysis. Look at the data in the table below and attempt to determine the behaviour of each cost before looking at the graphs derived from these data that are presented in the solution to this question. If you are honest with yourself, and don’t look first, you will appreciate the benefit of drawing a graph as a first step in the process of cost behaviour determination.
Step by Step Answer:

This question has not been answered yet.
You can Ask your question!
Related Book For 

Question Posted:
