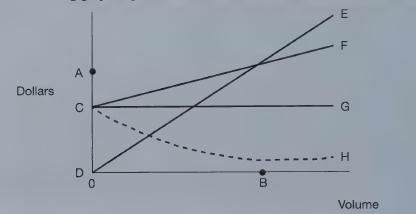
The following graph depicts cost-volume relationships for Tallmadge Company: Choose a labeled point or line on the
Question:
The following graph depicts cost-volume relationships for Tallmadge Company:

Choose a labeled point or line on the graph that best represents the behavior of each of the following items as operating volume is increased. Answers may be the same for more than one item. Answer each item independently.
a. Total sales revenue.
b. Total costs.
c. Total variable costs.
d. Total fixed costs.
e. Total mixed cost.
f. Break-even point.
Step by Step Answer:
Related Book For 

Managerial Accounting For Undergraduates
ISBN: 9780357499948
2nd Edition
Authors: James Wallace, Scott Hobson, Theodore Christensen
Question Posted:


