

Question: AP statistics scores 2016 In 2016, about 200,000 statistics students nationwide took the Advanced Placement Examination in statistics. The national distribution of scores and the
AP statistics scores 2016 In 2016, about 200,000 statistics students nationwide took the Advanced Placement Examination in statistics. The national distribution of scores and the results at Ithaca High School are shown in the table.
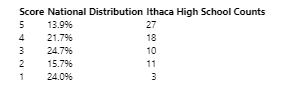
Is the distribution of scores at this high school significantly different from the national results? Explain.
Score National Distribution Ithaca High School Counts 5 13.9% 27 4 21.7% 18 10 NW in 3 24.796 15.796 2 1 24.0% 11 3
Step by Step Solution
3.41 Rating (157 Votes )
There are 3 Steps involved in it
H 0 The distribution of AP Statistics scores at Ithaca High School is the same as it is nationally H ... View full answer

Get step-by-step solutions from verified subject matter experts