

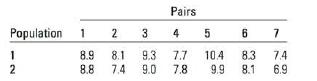
15.16 A paired-difference experiment was conducted to compare two populations. The data are shown in the table.
Question:
15.16 A paired-difference experiment was conducted to compare two populations. The data are shown in the table. Use a sign test to deter- mine whether the population distributions are different.
a. State the null and alternative hypotheses for the test.
b. Determine an appropriate rejection region with a = 0.01.
c. Calculate the observed value of the test statistic.
d. Do the data present sufficient evidence to indicate that populations 1 and 2 are different?
Fantastic news! We've Found the answer you've been seeking!
Step by Step Answer:

Answered By
Branice Buyengo Ajevi
I have been teaching for the last 5 years which has strengthened my interaction with students of different level.
1+ Reviews
10+ Question Solved
Related Book For 
Introduction To Probability And Statistics
ISBN: 9780176509804
3rd Edition
Authors: William Mendenhall
Question Posted:
