

17. An experiment measuring the percent shrinkage on drying of 50 clay specimens produced the following data:
Question:
17. An experiment measuring the percent shrinkage on drying of 50 clay specimens produced the following data:
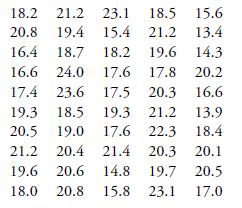
(a) Draw a stem and leaf plot of these data.
(b) Compute the sample mean, median, and mode.
(c) Compute the sample variance.
(d) Group the data into class intervals of size 1 percent starting with the value 13.0; and draw the resulting histogram.
(e) For the grouped data acting as if each of the data points in an interval was actually located at the midpoint of that interval, compute the sample mean and sample variance and compare this with the results obtained in parts (b)
and (c). Why do they differ?
Step by Step Answer:

This question has not been answered yet.
You can Ask your question!
Related Book For 

Introduction To Probability And Statistics For Engineers And Scientists
ISBN: 9780125980579
3rd Edition
Authors: Sheldon M. Ross
Question Posted:
