

20. The following table shows the number of defective, acceptable, and superior items in samples taken both
Question:
20. The following table shows the number of defective, acceptable, and superior items in samples taken both before and after the introduction of a modification in the manufacturing process
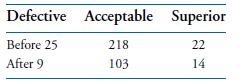
Is this change significant at the .05 level?
Fantastic news! We've Found the answer you've been seeking!
Step by Step Answer:

Answered By
Joemar Canciller
I teach mathematics to students because I love to share what I have in this field.
I also want to see the students to love math and be fearless in this field.
I've been tutoring these past 2 years and I would like to continue what I've been doing.
1+ Reviews
10+ Question Solved
Related Book For 

Introduction To Probability And Statistics For Engineers And Scientists
ISBN: 9780125980579
3rd Edition
Authors: Sheldon M. Ross
Question Posted:
