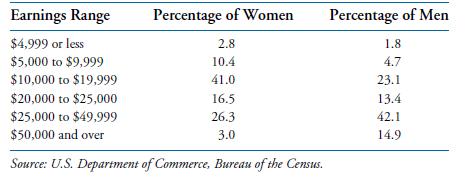
26. The following table uses 1989 data concerning the percentages of male and female full-time workers whose
Question:
26. The following table uses 1989 data concerning the percentages of male and female full-time workers whose annual salaries fall in different salary groupings. Suppose random samples of 1,000 men and 1,000 women were chosen. Use the table to approximate the probability that
(a) at least half of the women earned less than $20,000;
(b) more than half of the men earned $20,000 or more;
(c) more than half of the women and more than half of the men earned $20,000 or more;
(d) 250 or fewer of the women earned at least $25,000;
(e) at least 200 of the men earned $50,000 or more;
(f) more women than men earned between $20,000 and $24,999.

Fantastic news! We've Found the answer you've been seeking!
Step by Step Answer:
Related Book For 

Introduction To Probability And Statistics For Engineers And Scientists
ISBN: 9780125980579
3rd Edition
Authors: Sheldon M. Ross
Question Posted:


