

3.12 Consider this set of bivariate data: a. Draw a scatterplot to describe the data. b. Does...
Question:
3.12 Consider this set of bivariate data:
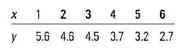
a. Draw a scatterplot to describe the data.
b. Does there appear to be a relationship between .x and y? If so, how do you describe it?
c. Calculate the correlation coefficient, r. Does the value of r confirm your conclusions in part b? Explain.
Step by Step Answer:

This question has not been answered yet.
You can Ask your question!
Related Book For 
Introduction To Probability And Statistics
ISBN: 9780176509804
3rd Edition
Authors: William Mendenhall
Question Posted:
