

3.28 Federal Contaminated Sites (2005) The data in the following table give the number of federal contaminated
Question:
3.28 Federal Contaminated Sites (2005) The data in the following table give the number of federal contaminated sites for provinces and territories along with the size of the province/territory, and the percentage of the total area.
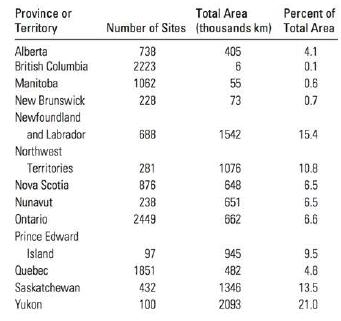
a. Draw a scatterplot with MINITAB. Is there any clear pattern in the scatterplot? Describe the relationship between number of contaminated sites and the size of the province/territory.
b. Use the MINITAB output to calculate the correlation coefficient. Does this confirm your answer to part a?
c. Are there any outliers or clusters in the data? If so, can you explain them?
Step by Step Answer:

This question has not been answered yet.
You can Ask your question!
Related Book For 

Introduction To Probability And Statistics
ISBN: 9780176509804
3rd Edition
Authors: William Mendenhall
Question Posted:
