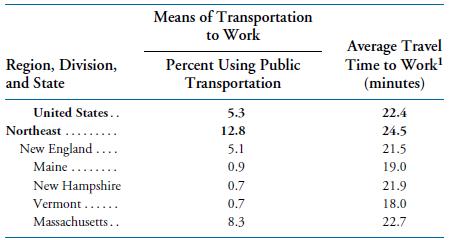
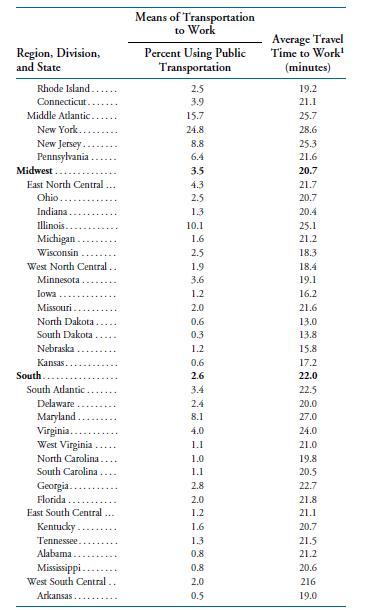
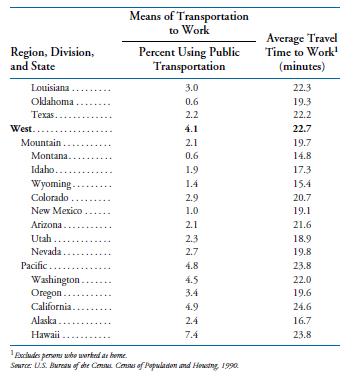
4. The following table gives the average travel time to work for workers in each of the...
Question:
4. The following table gives the average travel time to work for workers in each of the 50 states as well as the percentage of those workers who use public transportation.
(a) Represent the data relating to the average travel times in a histogram.
(b) Represent the data relating to the percentage of workers using public transportation in a stem and leaf plot.


Step by Step Answer:
Related Book For 

Introduction To Probability And Statistics For Engineers And Scientists
ISBN: 9780125980579
3rd Edition
Authors: Sheldon M. Ross
Question Posted:


