

7. The following are X and S values for 20 subgroups of size 5. (a) Determine trial...
Question:
7. The following are X and S values for 20 subgroups of size 5.
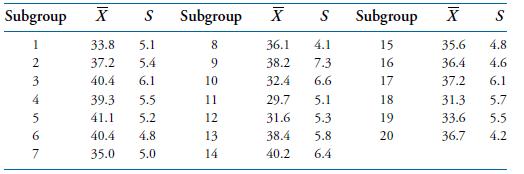
(a) Determine trial control limits for an X -control chart.
(b) Determine trial control limits for an S-control chart.
(c) Does it appear that the process was in control throughout?
(d) If your answer in part
(c) is no, suggest values for upper and lower control limits to be used with succeeding subgroups.
(e) If each item is supposed to have a value within 35 ± 10, what is your estimate of the percentage of items that will fall within this specification?
Fantastic news! We've Found the answer you've been seeking!
Step by Step Answer:

Answered By
Vijesh J
My passion to become a tutor is a lifetime milestone. Being a finance and marketing professional with hands-on experience in wealth management, portfolio management, team handling and actively contributing in promoting the company. Highly talented in managing and educating students in most attractive ways were students get involved. I will always give perfection to my works. Time is the most important for the works and I provide every answer on time without a delay. I will proofread each and every work and will deliver a with more perfection.
5+ Reviews
15+ Question Solved
Related Book For 
Introduction To Probability And Statistics For Engineers And Scientists
ISBN: 9780125980579
3rd Edition
Authors: Sheldon M. Ross
Question Posted:
