

Along with the salaries for the 400 professors in Example 3.1, the researcher recorded two qualitative variables
Question:
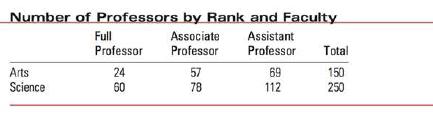
Along with the salaries for the 400 professors in Example 3.1, the researcher recorded two qualitative variables for each professor: rank and faculty. Table 3.2 shows the number of professors in each of the 2 3 = 6 categories. Use comparative charts to describe the data. Do the faculties of science employ as many high-ranking professors as the faculties of arts do?
Fantastic news! We've Found the answer you've been seeking!
Step by Step Answer:

Answered By
Sagar Kumar
I am Mechanical Engineer with CGPA of 3.98 out of 4.00 from Pakistan. I went to Government Boys Degree College, Sehwan for high school studies.
I appeared in NUST Entrance Exam for admission in university and ranked #516. My mathematics are excellent and I have participated in many math competitions and also won many of them. Recently, I participated in International Youth Math Challenge and was awarded with Gold Honor. Now, I am also an ambassador at International Youth Math Challenge,
I have been teaching when I was in 9th class class year 2012. I have taught students from 6th class to university level.
1+ Reviews
10+ Question Solved
Related Book For 
Introduction To Probability And Statistics
ISBN: 9780176509804
3rd Edition
Authors: William Mendenhall
Question Posted:
