

An occupational hygienist believes that a two-hour training session on proper hand washing will improve time spent on hand washing. Based on a random sample
An occupational hygienist believes that a two-hour training session on proper hand washing will improve time spent on hand washing. Based on a random sample of 25 high school students who had attended the session, their hand washing times (in seconds) were recorded as follows:
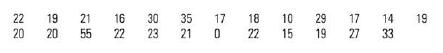
a. Calculate the sample mean, mode, and median of this data set. Are the data mound- shaped?
b. If you were asked to select a central value to describe the data, which measure of central tendency would you use? Explain.
c. Calculate the value of the sample standard deviation (s) and the range (R), and use R to approximate s. Is this a good approximation?
d. What would happen to the mean of time spent to wash hands if all data points were raised by 4%?
e. What would happen to the standard deviation of time spent to wash hands if all data points were raised by 5%?
f. Find the percentage of measurements in the intervals s and x + 2s. Com- pare these results with the Empirical Rule and Tchebysheff's Theorem percentages respectively. g. Can you use Tchebysheff's Theorem to describe this data set? Why or why not? h. Can you use the Empirical Rule to describe this data set? Why or why not? i. Which, if any, of the observations appear to be outliers? Justify your answer. j. Find the 25th, 50th, and 75th percentiles. What is the value of the interquartile range? k. Compare range with interquartile range. What conclusion can you draw, if any? 1. Construct a box plot for this data. Does the box plot indicate the presence of any outliers?
m. Construct side-by-side box plots for this data and data given in Project 1-B (page 53). HINT: see exercise 2.77, page 95. n. Looking at these box plots, how would you compare the amount of time spent on washing hands? o. Can you infer (conclude) that the training session was useful in reducing the risk of catching flu? In other words, do you support the conjecture of the occupational hygienist? p. Now combine both data sets and make a histogram of the amount of time spent on hand washing and comment on the shape of the distribution.
16 22 23 22 30 35 17 18 10 29 17 14 19 21 0 22 15 19 27 33 222 19 21 92 25 20 20 55
Step by Step Solution
There are 3 Steps involved in it
Step: 1

Get step-by-step solutions from verified subject matter experts
100% Satisfaction Guaranteed-or Get a Refund!
Step: 2Unlock detailed examples and clear explanations to master concepts

Step: 3Unlock to practice, ask and learn with real-world examples
See step-by-step solutions with expert insights and AI powered tools for academic success
-
 Access 30 Million+ textbook solutions.
-
Ask unlimited questions from AI Tutors.
-
Order free textbooks.
-
100% Satisfaction Guaranteed-or Get a Refund!
Claim Your Hoodie Now!
Authors: William Mendenhall
3rd Edition
0176509801, 9780176509804

Study Smart with AI Flashcards
Access a vast library of flashcards, create your own, and experience a game-changing transformation in how you learn and retain knowledge
Explore Flashcards

