Project 1-A: Five Tips for Keeping Your Home Safe This Summer Source: From Keeping Your Home Safe
Question:
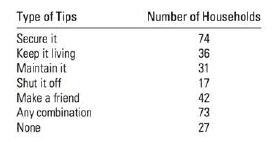
Project 1-A: Five Tips for Keeping Your Home Safe This Summer Source: From "Keeping Your Home Safe" by Kim Fisher, Canadian Living, July 2008. 1. Secure it. Take a walk around your property. Do you see any way to get in? Pur- chase a good lock with a reputable brand name ($100 to $150 at a local hardware store) and lock up ladders, patio furniture, recycling bins, and anything else a thief could use to gain access to a second-storey window. 2. Keep it living. Your home is less likely to catch the attention of a thief if it looks like it's being lived in, so it should reflect your regular schedule and give the indica- tion that someone is at home. 3. Maintain it. A home that's well cared for is a less attractive target for thieves. Trim hedges that exceed window height and cut evergreen branches up at least three feet from the ground to eliminate hiding places on your property. 4. Shut it off. If you're going on vacation for more than a few weeks, turn off the water to your home and drain the lines (turn on your taps for a few minutes and flush your toilets). 5. Make a friend. Find a friend or neighbour you trust to keep an eye on your home. Have her cut the grass, park a car in your driveway, pick up your mail, and even put out some extra garbage on garbage day. Due to an increasing number of break-ins in a particular subdivision of North York, an insurance company specializing in property insurance is interested in knowing how many people follow the above tips. A statistical consultant was hired to provide such information. The consultant conducted a survey of 300 randomly selected households and the results of her findings are summarized in the following table.

a. Identify and describe the population and sample in this problem.
b. Are the collected data based on sample or population?
c. What are the experimental units?
d. What is the variable being measured?
e. Is the variable qualitative or quantitative?
f. Is the variable of interest discrete or continuous? g. Summarize these data in a bar chart, and explain what the chart tells us. h. Determine the relative frequencies. i. Construct a relative frequency bar chart. j. Construct a pie chart to describe the data. k. What proportion of people responded positively to tips "Secure it" or "Make a friend"? 1. Collect similar data in your neighbourhood (must get permission by appropriate authorities) and see if your data result is consistent with this data.
Step by Step Answer:

Introduction To Probability And Statistics
ISBN: 9780176509804
3rd Edition
Authors: William Mendenhall


