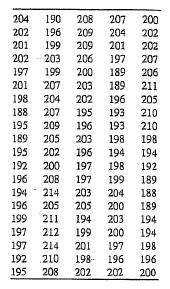
. The data shown here are concentration. readings from a chemical process, made every 30 minutes (read...
Question:
.
The data shown here are concentration.
readings from a chemical process, made every 30 minutes (read down, then across from left to right).

(a) Calculate the sample aurocorrela-
tion function and provide an inter-
pretation.
(b) Construct an individuals control chart with the standard deviation estimated using the moving range method. Provide an interpretation of this control chart,
(c) Fit a first-order. autoregressive model x, = € + px ,- 1 + 8, to the data.
Set up an individuals control chart on the residuals from this model.
. Interpret this chart.
(d) Are the residuals from the model in pant
(c) uncorrelated? Does this have any impact on your interpreta-
tion of the control chart from part (c)?
Step by Step Answer:

Introduction To Statistical Quality Control
ISBN: 9780471656319
5th Edition
Authors: Douglas C. Montgomery


