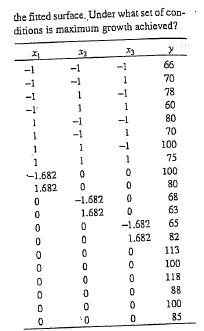
. The data shown in the following table were collected in an experiment to opti- mize crystal...
Question:
. The data shown in the following table were collected in an experiment to opti-
mize crystal growth as a function of three variables .x1, x2, and x5. Large val-
ues of y (yield in grams) are desirable.
Fit a second-order model and analyze

Fantastic news! We've Found the answer you've been seeking!
Step by Step Answer:
Related Book For 

Introduction To Statistical Quality Control
ISBN: 9780471656319
5th Edition
Authors: Douglas C. Montgomery
Question Posted:


