Question:
(a) Use the Clausius–Clapeyron equation and data for water at 100°C to develop an expression for the vapor pressure of water as a function of temperature.
(b) Plot the expression you came up with on a PT diagram for temperatures from 0.01°C to 100°C.
(c) Include data from the steam tables on your plot in part
(b) and comment on the adequacy of the Clausius–Clapeyron equation.
(d) Repeat parts (b) and (c) for 100°C to 200°C.
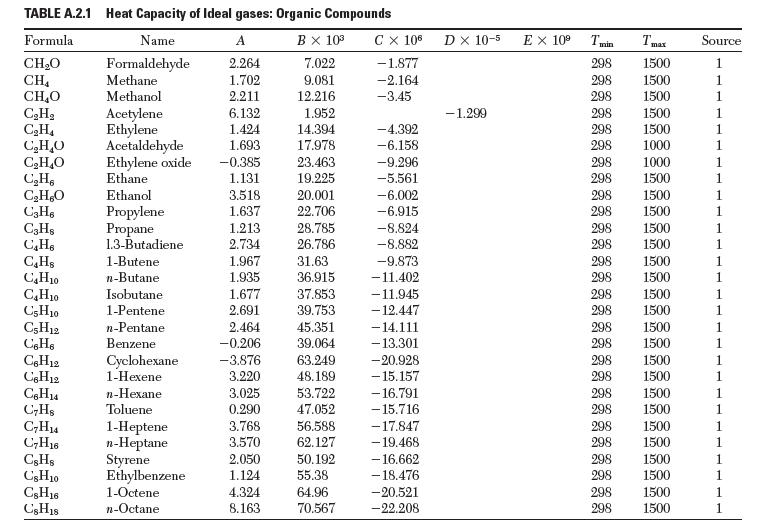
(e) Repeat parts (a)–(c), but correct for the temperature dependence of Dhvap, using heat capacity data from Appendix A.2.
Transcribed Image Text:
TABLE A.2.1 Heat Capacity of Ideal gases: Organic Compounds Formula Name B X 10 CHO 7.022 Formaldehyde Methane CH 9.081 CHO Methanol 12.216 CH CH4 CHO CHO CH6 CHO C3H6 C3Hs C4H C4Hs C4H10 CH0 C3H10 C5H12 C6H6 C6H12 C6H12 C6H4 C7Hs C7H4 C7H16 CsHs CsH10 CsH16 CsH18 Acetylene Ethylene Acetaldehyde Ethylene oxide Ethane Ethanol Propylene Propane 1.3-Butadiene 1-Butene n-Butane Isobutane 1-Pentene n-Pentane Benzene Cyclohexane 1-Hexene n-Hexane Toluene 1-Heptene n-Heptane Styrene Ethylbenzene 1-Octene n-Octane A 2.264 1.702 2.211 6.132 1.424 1.693 -0.385 1.131 3.518 1.637 1.213 2.734 1.967 1.935 1.677 2.691 2.464 -0.206 -3.876 3.220 3.025 0.290 3.768 3.570 2.050 1.124 1.952 14.394 17.978 23.463 19.225 20.001 22.706 28.785 26.786 31.63 36.915 37.853 39.753 45.351 39.064 63.249 48.189 53.722 47.052 56.588 62.127 50.192 55.38 4.324 64.96 8.163 70.567 C X 106 -1.877 -2.164 -3.45 -4.392 -6.158 -9.296 -5.561 -6.002 -6.915 -8.824 -8.882 -9.873 -11.402 -11.945 -12.447 - 14.111 -13.301 -20.928 -15.157 -16.791 -15.716 -17.847 - 19.468 - 16.662 - 18.476 -20.521 -22.208 D X 10-5 EX 10 -1.299 298 298 298 298 298 298 298 298 298 298 298 1500 298 1500 298 1500 298 1500 1500 1500 298 298 298 298 298 298 298 298 298 298 Tmax 1500 1500 1500 298 298 298 298 1500 1500 1000 1000 1500 1500 1500 1500 1500 1500 1500 1500 1500 1500 1500 1500 1500 1500 1500 Source 1 1 1 1 1 1 1 1 1 1 1 1 1 1 1 1 1 1 1 1 1 1 1 1 1 1


