

Question: a. Construct a frequency distribution table for weights of male participants using the classes 91125, 126160, 161195, 196230, and 231265. b. Calculate the relative frequency
a. Construct a frequency distribution table for weights of male participants using the classes 91–125, 126–160, 161–195, 196–230, and 231–265.
b. Calculate the relative frequency and percentage for each class.
c. Construct a histogram for the relative frequency distribution of part b.
d. What percentage of the male participants have weights less than 161 lbs?
The following table includes partial data for a health fair held at a local mall by community college nursing students. The data are provided for 30 male and 30 female participants who stopped by the health fair booth. Data includes participant’s age to the nearest year, body weight in pounds, and blood glucose level measured in mg/dL.
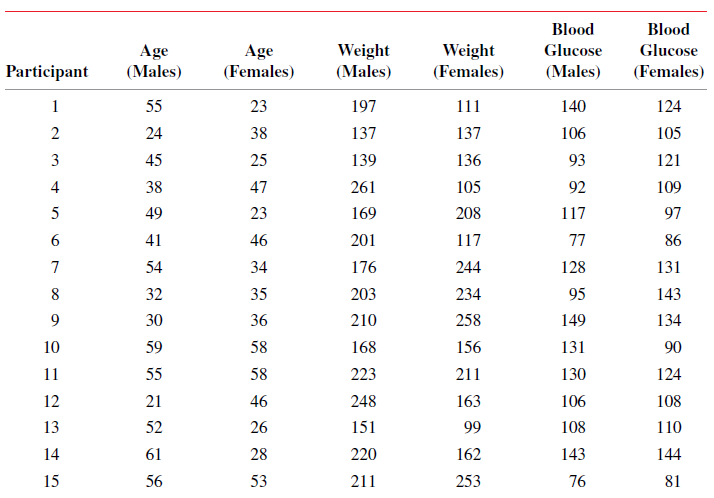
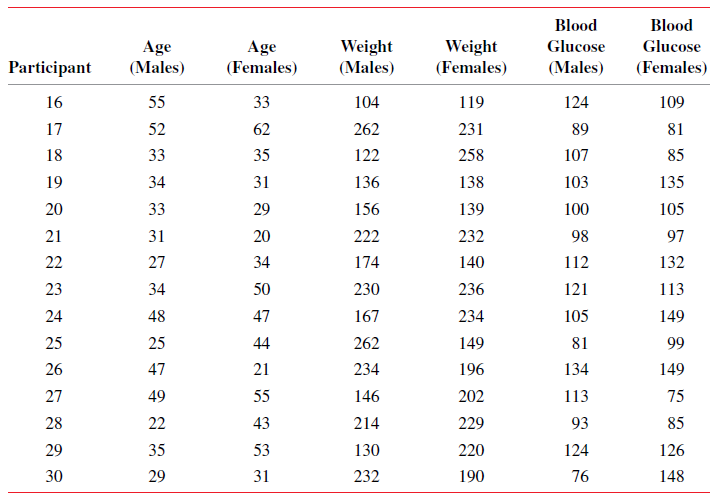
Blood Blood Age (Males) Age (Females) Weight (Males) Weight (Females) Glucose Glucose Participant (Males) (Females) 111 55 23 197 140 124 137 2 24 38 137 106 105 3 25 139 136 93 121 45 4 38 47 261 105 92 109 49 23 169 208 117 97 41 46 201 117 77 86 54 34 176 244 128 131 95 32 35 203 234 143 149 9. 30 36 210 258 134 10 59 58 168 156 131 90 223 211 11 55 58 130 124 248 12 21 46 163 106 108 13 52 26 151 99 108 110 14 61 28 220 162 143 144 15 56 53 211 253 76 81
Step by Step Solution
3.50 Rating (173 Votes )
There are 3 Steps involved in it
a and b c d 2 730 30 of male participants weighed ... View full answer

Get step-by-step solutions from verified subject matter experts