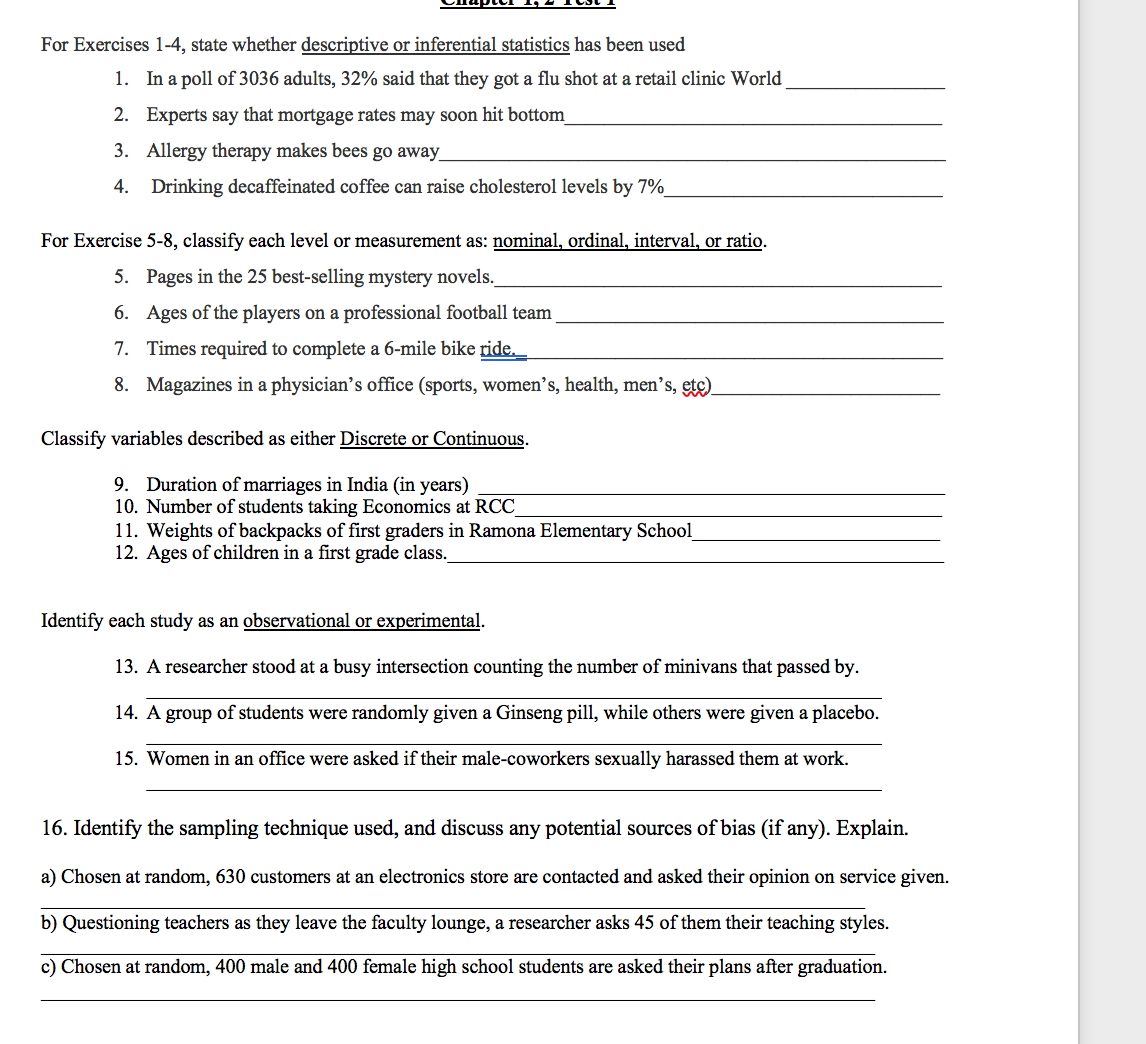
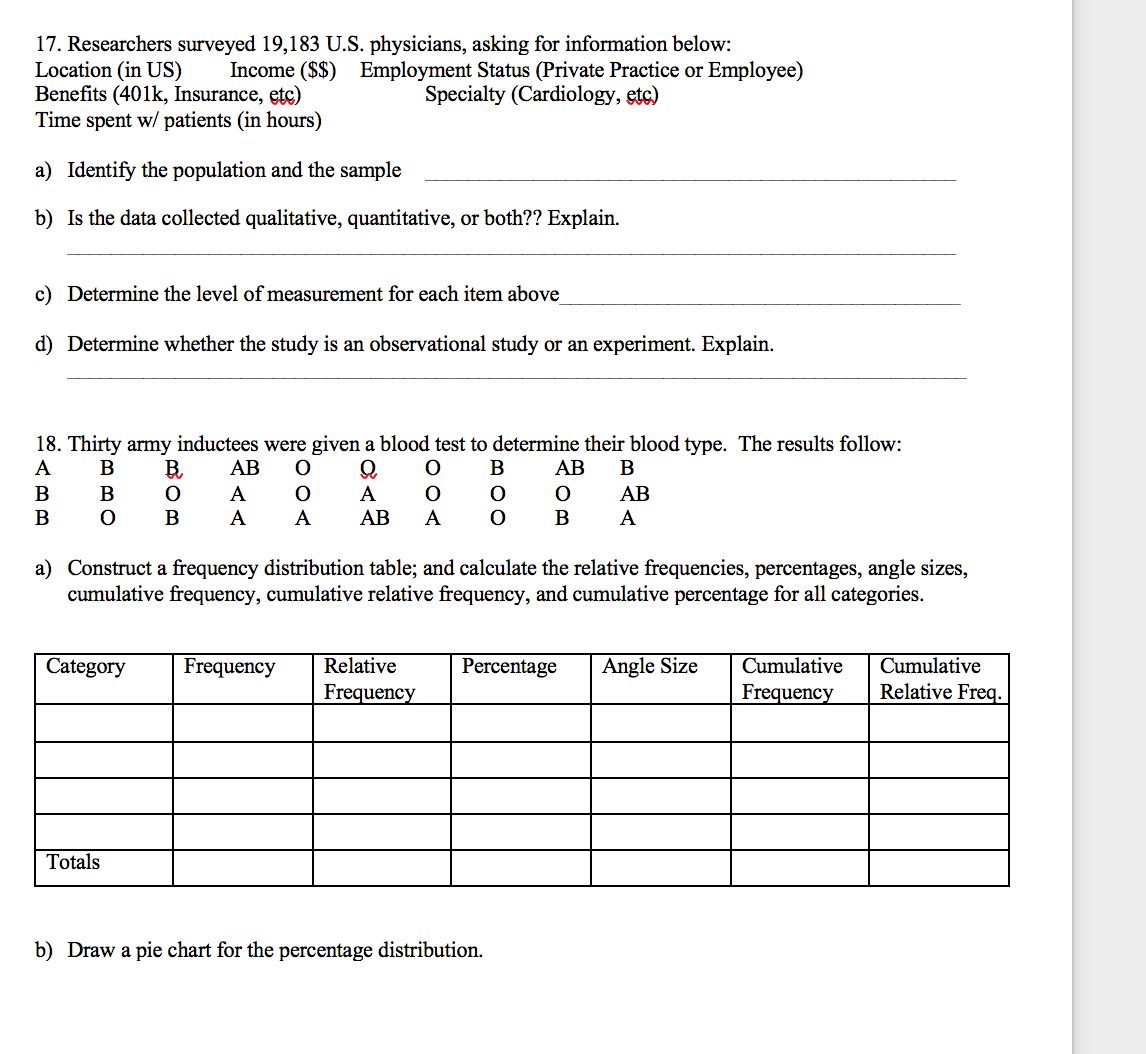
unclean: 1.": Anal 1 For Exercises 1-4, state whether descriptive or inferential statistics has been used 1. In a poll of 3036 adults, 32% said that they got a u shot at a retail clinic World 2. Experts say that mortgage rates may soon hit bottom 3. Allergy therapy makes bees go away 4. Drinking decaffeinated coffee can raise cholesterol levels by 7% For Exercise 5-8, classify each level or measurement as: nominal ordinal interval or ratio. 5. Pages in the 25 best-selling mystery novels. 6 Ages of the players on a professional football team '1'. Times required to complete a 6-mile bike dL 8 Magazines in a physician's ofce (sports, women's, health, men' s, 519 Classify variables described as either Discrete or Continuous. 9. Duration of marriages in India (in years) 10. Number of students taking Economics at RCC 11. Weights of backpacks of rst graders in Ramona Elementary School 12. Ages of children in a rst grade class. Identify each study as an observational or experimental. 13. A researcher stood at a busy intersection counting the number of minivans that passed by. 14. A group of students were randomly given a Ginseng pill, while others were given a placebo. 15. Women in an ofce were asked if their male-coworkers sexually harassed them at work. 16. Identify the sampling technique used, and discuss any potential sources of bias (if any). Explain. a) Chosen at random, 630 customers at an electronics store are contacted and asked their opinion on service given. b) Questioning teachers as they leave the faculty lounge, a researcher asks 45 of them their teaching styles. c) Chosen at random, 400 male and 400 female high school students are asked their plans after graduation. 17. Researchers surveyed 19,183 U.S. physicians, asking for information below: Location (in US) Income ($$) Employment Status (Private Practice or Employee) Benefits (401k, Insurance, etc) Specialty (Cardiology, etc) Time spent w/ patients (in hours) a) Identify the population and the sample b) Is the data collected qualitative, quantitative, or both?? Explain. c) Determine the level of measurement for each item above d) Determine whether the study is an observational study or an experiment. Explain. 18. Thirty army inductees were given a blood test to determine their blood type. The results follow: A B B AB O Q B AB B B A A AB B O B A A AB A O B A a) Construct a frequency distribution table; and calculate the relative frequencies, percentages, angle sizes, cumulative frequency, cumulative relative frequency, and cumulative percentage for all categories. Category Frequency Relative Percentage Angle Size Cumulative Cumulative Frequency Frequency Relative Freq. Totals b) Draw a pie chart for the percentage distribution