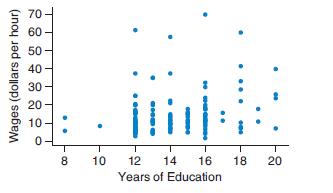
The figure shows a scatterplot of the wages and educational level of some people. Describe what you
Question:
The figure shows a scatterplot of the wages and educational level of some people. Describe what you see. Explain the trend and mention any unusual points.

Transcribed Image Text:
70 60 50 40 30 20 10 8 10 12 14 16 18 20 Years of Education Wages (dollars per hour) ..
Fantastic news! We've Found the answer you've been seeking!
Step by Step Answer:
Answer rating: 50% (10 reviews)
The scatterplot you provided represents the relationship between wages dollars per hour on the vertical axis and years of education on the horizontal ...View the full answer

Answered By

Abhijath Reghunadhan
I never had a chance to be a teacher. would love to do it here first time.
0.00
0 Reviews
10+ Question Solved
Related Book For 

Introductory Statistics Exploring The World Through Data
ISBN: 9780135163146
3rd Edition
Authors: Robert Gould, Rebecca Wong, Colleen N. Ryan
Question Posted:
Students also viewed these Mathematics questions
-
We do have standard procedures and rules and regulations. The underlying principle is to keep them to a minimum, and its about questioning why we need them. If theres a business reason why that is...
-
The figure shows a scatterplot of birthrate (live births per 1000 women) and age of the mother in the United States. Would it make sense to find the correlation for this data set? Explain. According...
-
Figure A.13 shows a scatterplot of height and weight for a new sample of 105 college students. Figure A.13 (a) Does there appear to be a positive or a negative relationship in the data? (b) Describe...
-
Given the sprinkler system layout in Figure A, calculate the flow and pressure required at point RN#1 (point B in Figure B) without considering the impact of velocity pressures. Note that RN#1 (point...
-
Calculate the account balance for each of the following: Accounts Receivable 1,000 650 400 920 920 1,500 Accounts Payable 250 250 900 1,800 650 1,400 Service Revenue 13,000 2,500 810 3,500 3,000 650...
-
A pepper seed is placed in front of a lens. The lateral magnification of the seed is + 0.300. The absolute value of the lens's focal length is 40.0 cm. How far from the lens is the image?
-
Am I prepared to explain how I would like to make a contribution? LO.1
-
Larissa Company has a unit selling price of $250, variable costs per unit of $170, and fixed costs of $140,000. Compute the break-even point in units using (a) The mathematical equation and (b)...
-
5.00 points 0 5,05% O 10.09% 11.10% O 12.11% 9.09%
-
1. In what ways does Trader Joes demonstrate the importance of each responsibility in the management process planning, organizing, leading and controlling? 2. This is a German company operating in...
-
The following figure shows a scatterplot of the educational level of twins. Describe the scatterplot. Explain the trend and mention any unusual points. 20 18 - 16 - 14 - 12 - 10 8 5 10 15 20...
-
If we flip a coin 10 times, what percentage of the time will the coin land on heads? A first step to answering this question is to simulate 10 flips. Use the random number table in Appendix A to...
-
Calculate the transformer turns ratio required to connect four parallel 16- speakers so that they appear as an 8-k effective load.
-
1) Why do you believe that in recent years PE sponsors have increasingly chosen to buy debt in their distressed LBOs? 2) What are the pros and cons of this investment strategy? 3) What issues are...
-
Paper Street Soap Company Ltd conducts a business that makes luxury soaps. It operates a factory in Oyster Bay near Sydney. The factory contains a large amount of equipment that is used in the...
-
TRANSACTION ANALYSIS: Dartmouth Ties Corporation is a merchandising company that has been in operation for two years. The company sell high - end ties for men. They purchase their inventory from...
-
Using your knowledge of types of group influence and of subcultures, explain the potential impact on consumer behavior of Methodism's tightening of its ban on gay marriage and LGBTA clergy. Write in...
-
A language L over an alphabet is co-finite, if * \ Lis empty or finite. Let COFNFA = {(N) | N is a NFA accepting a co-finite language}. Show that COF NFA is decidable.
-
Selected accounts of Annis Consulting, Inc., a financial services business, have the following balances at December 31, 2018, the end of its first year of operations. During the year, Laura Annis,...
-
Refer to Example 9.15. Add the following functionality to this program: Allow the user to enter the cost of a gallon of gas on each trip and use a function, Cost() to calculate the cost of purchasing...
-
Rats had a choice of freeing another rat or eat ing chocolate by themselves. Most of the rats freed the other rat and then shared the chocolate with it. The table shows the data concerning the gender...
-
A statistics student performed a study on male and female criminals 15 years old and under who were on probation in Ventura County, California. The purpose was to see whether there was an association...
-
In a randomized, placebo controlled, double-blind study, 55 children (5 to 11 years old) who had an egg allergy were randomly assigned either oral immunotherapy or placebo. After 10 months of...
-
Alado fis istirmerfs Tat likifond 205L [ridont inip lanod whadtinion? hingend is antan Qultit foer avdeed Divdasit errem yodichiders Etexlpoges Getmare nelp
-
The limitation on the deduction of business interest does not apply to non-corporate taxpayers. course hero True or False explain?
-
If the auditor believes that the financial statements prepared on the basis of the entity's income tax are not adequately titled, the auditor should : A)Issue a resignation of opinion. B)Explain the...

Study smarter with the SolutionInn App


