

Figure A.13 shows a scatterplot of height and weight for a new sample of 105 college students.
Question:
Figure A.13
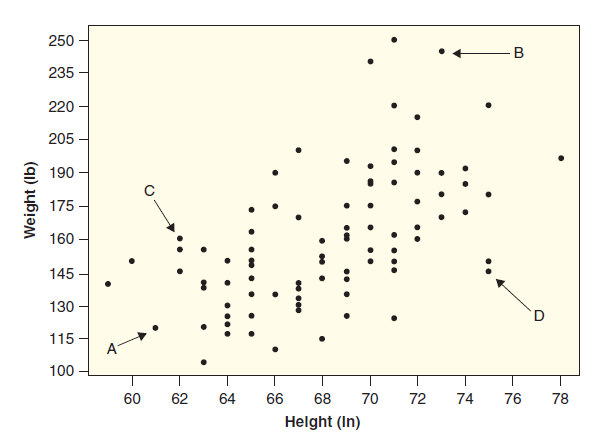
(a) Does there appear to be a positive or a negative relationship in the data?
(b) Describe the body shape of the individuals whose points are labeled by A, B, C, and D.
Fantastic news! We've Found the answer you've been seeking!
Step by Step Answer:
a The general trend in this data appears to be up and to the right so the...View the full answer

Answered By
Rohith Bellamkonda
I am studying in IIT Indore,the most prestigious institute of India.I love solving maths and enjoy coding
1+ Reviews
10+ Question Solved
Related Book For 

Statistics Unlocking The Power Of Data
ISBN: 9780470601877
1st Edition
Authors: Robin H. Lock, Patti Frazer Lock, Kari Lock Morgan, Eric F. Lock, Dennis F. Lock
Question Posted:
