All Matches
Solution Library
Expert Answer
Textbooks
Search Textbook questions, tutors and Books
Oops, something went wrong!
Change your search query and then try again
Toggle navigation
FREE Trial
S
Books
FREE
Tutors
Study Help
Expert Questions
Accounting
General Management
Mathematics
Finance
Organizational Behaviour
Law
Physics
Operating System
Management Leadership
Sociology
Programming
Marketing
Database
Computer Network
Economics
Textbooks Solutions
Accounting
Managerial Accounting
Management Leadership
Cost Accounting
Statistics
Business Law
Corporate Finance
Finance
Economics
Auditing
Hire a Tutor
AI Study Help
New
Search
Search
Sign In
Register
study help
mathematics
statistics the art and science
Questions and Answers of
Statistics The Art and Science
Select any two quantitative variables in any dataset used thus far in the text, avoiding those analyzed so far in Chapter 9.(a) Identify the dataset and variables you are using. Indicate which
There were 136 movies made in Hollywood in 2011. Suppose that, for a documentary about Hollywood film crews, a random sample of five of these movies will be selected for in-depth interviews with the
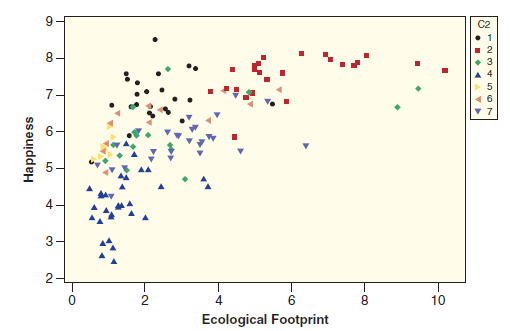
In Exercise 2.172 on page 114, we introduced the dataset HappyPlanetIndex. This exercise asks you to use technology to investigate more variables and relationships in that dataset.(a) Use technology
The dataset US States has a great deal of information on the 50 states in the US, including two categorical variables and 14 quantitative variables. In the questions that follow, we ask you to use
To measure the effectiveness of a new teaching method for math in elementary school, each student in a class getting the new instructional method is matched with a student in a separate class on IQ,
Choose one of the following datasets: USStates, Hollywood- Movies2011, All Countries, or NBA Players 2011, and then select any two quantitative variables that we have not yet analyzed. Use technology
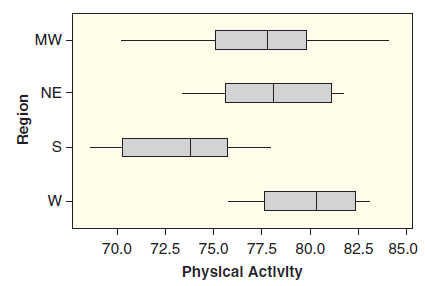
Exercise 2.134 examined the relationship between region of the country and level of physical activity of the population of US states. From the USStates dataset, examine a different relationship
From the StudentSurvey dataset, select any categorical variable and select any quantitative variable. Use technology to create side-by-side boxplots to examine the relationship between the variables.
The Hardee’s Restaurant chain has about 1900 quickserve restaurants in 30 US states and 9 countries. Suppose that a member of the Hardee’s administration wishes to visit six of these restaurants,
Come up with your own question you would like to be able to answer. What is the question? How might you collect data to answer this question? What would the cases be? What would the variable(s) be?
In 100–200 words, explain to someone who has never studied statistics the purpose of multiple regression and when you would use it to analyze a data set or investigate an issue. Give an example of
Go to the GSS codebook at sda.berkeley.edu/GSS. Your instructor will assign a categorical response variable. Conduct a research study in which you find at least two other categorical variables that
Your instructor will pick a medical topic of interest to the class. Find a recent article of a medical journal that reports results of a research study on that topic. Describe the statistical
A study compares a new drug for pain relief in patients with chronic migraine against a placebo. Each patient is given both the drug and the placebo (in random order) and reports which one works
Give an example of a null hypothesis and an alternative hypothesis about a (a) population proportion (b) population mean.
The instructor will assign the class a theme to study. Download recent results for variables relating to that theme from sda.berkeley.edu/GSS. Find and interpret confidence intervals for relevant
A column by New York Times columnist Nicholas Kristof (August 15, 2003) discussed results of polls indicating that religious beliefs in the United States tend to be quite different from those in
Access the Sampling Distribution for a Sample Mean web app and select Build Own as the shape for the population distribution. By typing numbers into the text field, you can create your own population
In professional baseball, basketball, and hockey in North America, the final two teams in the playoffs play a best of seven series of games. The first team to win four games is the champion.
In Example 16, we explored the number of rolls it takes to win the game. In reality, it’s not the number of rolls but rather the time it takes to move 12 spaces that dictates who wins the game.
This activity illustrates how sampling bias can result when you use a nonrandom sample, even if you attempt to make it representative: You are in a geography class, discussing center and variability
Find an example of a randomized experiment from a newspaper, journal, the Internet, or some other media.a. Identify the explanatory and response variables.b. What were the treatments? What were the
Find an example of an observational study from a newspaper, journal, the Internet, or some other medium.a. Identify the explanatory and response variables and the population of interest.b. What type
Find an example of results of an Internet poll. Do you trust the results of the poll? If not, explain why not.
Go to a website for an online medical journal, such as British Medical Journal (www.bmj.com). Pick an article in a recent issue.a. Was the study an experiment or an observational study?b. Identify
Using the Internet, find a study about cell phone use and its potential risk when used by drivers of automobiles.a. Was the study an experiment or an observational study?b. Identify the response and
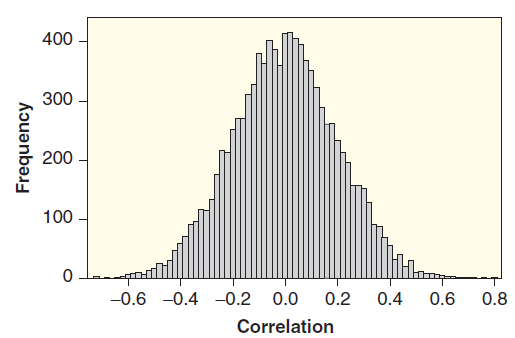
The Guess the Correlation web app accessible at the book’s website allows you to guess the correlation r with randomly generated data points. How close are your guesses to the actual correlation of
The Explore Linear Regression web app accessible at the book’s website lets you add and delete points on a scatterplot. The regression line is automatically calculated for the points you provide.a.
Is there a relationship between the amount of time a student studies and a student’s GPA? Access the Georgia Student Survey file on the book’s website or use your class data to explore this
Is a baseball team’s earned run average 1ERA = the average number of earned runs they give up per game2 a good predictor of the number of wins that a team has for a season? The data for the
Access the General Social Survey at sda.berkeley.edu/GSS.a. Find the frequency table and histogram for Example 6 on TV watching. (Hint: Enter TVHOURS as the row variable, YEAR(2012) as the selection
For the Mean Versus Median web app, using the option “Supply own sample” from the drop down menu, your instructor will give you a data set to illustrate the effect of extreme observations on the
Go to www.google.com/trends and click Explore in Depth. Look up a subject of interest to you and try to create a time plot that shows interest in the subject over time. Interpret the plot and suggest
Is there a difference in how much males and females spend on haircuts? Access the Georgia Student Survey data file on the book’s website or use your class data to explore this question, using
The Baseball’s HR Hitters file on the book’s website contains data on the number of home runs hit each season by some of baseball’s great home run hitters. Analyze these data by using
Search some publications and find an example of a graph that violates at least one of the principles for constructing good graphs. Summarize what’s wrong with the graph and explain how it could be
Go to espn.go.com/mlb/teams and select a (or your favorite) team. Click Roster and then Salary. Copy the salary figures for the players into a software program and create a histogram. Describe the
Your instructor will help the class create a data file consisting of the values for class members of characteristics based on responses to a questionnaire like the one that follows. Alternatively,
On a final exam that one of us recently gave, students were asked, “How would you define ‘statistics’ to someone who has never taken a statistics course?” One student wrote, “You want to
At the GSS website, click Standard Codebook under Codebooks and then click Sequential Variable List. Find a subject that interests you and look up a relevant GSS code name to enter as the row
The dataset Employed ACS contains just the subset of people in the dataset ACS who were employed (n = 431). Income gives each person’s wages or salary income in the past 12 months (in thousands of
One of the authors of this book used to be a professional figure skater. For her project when she took introductory statistics (from another author of this book), she was interested in which of two
Ultimate Frisbee games often begin by flipping two discs (tossing them as you would when flipping a coin), while someone calls Same (both face up or both face
People were recruited for a study on weight loss, in which participants were randomly assigned to one of four groups. Group 1 was given exercise instructions but no dietary instructions, group 2 was
A student wants to predict his score on the MCAT exam (which is being revised to include statistical concepts beginning in 2015!) and wants to use all information available to him. He has anonymous
Common wisdom says that every dog year corresponds to 7 human years, so the human equivalent maturity level of a dog can be found by multiplying a dogs age by 7. If the human maturity age
Is percentage of the national budget spent on health care associated with life expectancy for countries?We have learned a lot of methods in this course, some of which are given below. State which
What percentage of Americans support samesex marriage?We have learned a lot of methods in this course, some of which are given below. State which statistical method would be most appropriate for the
Does average number of ounces of alcohol consumed each week, per person, differ by class year (First Year, Sophomore, Junior, Senior) among college students?We have learned a lot of methods in this
Is there an association between whether or not a person is smiling and whether or not the sun is shining?We have learned a lot of methods in this course, some of which are given below. State which
How many times a day do humans urinate, on average?We have learned a lot of methods in this course, some of which are given below. State which statistical method would be most appropriate for the
Do people drive less (fewer miles) when gas prices are higher?We have learned a lot of methods in this course, some of which are given below. State which statistical method would be most appropriate
In one of his adventures, Sherlock Holmes found footprints made by the criminal at the scene of a crime and measured the distance between them. After sampling many people, measuring their height and
Every week during the Vietnam War, a body count (number of enemy killed) was reported by each army unit. The last digits of these numbers should be fairly random. However, suspicions arose that the
The Career Planning Office is interested in college seniors' plants and how they might relate to their majors. A large number of students are wrveyed and classified according to their major (Natural
Researchers were commissioned by the Violence In Childrens Television Investigative Monitors (VICTIM) to study the frequency of depictions of violent acts in Saturday morning TV fare.
The Hawaiian Planters Association is developing three new strains of pineapple (call them A, B, and C) to yield pulp with higher sugar content. Twenty plants of each variety (60 plants in all) are
Anthropologists have found two burial mounds in the same region. They know that several different tribes lived in the region and that the tribes have been classified according to different lengths of
In Exercise E.5 we find that males have a higher average yearly income than females, in Exercise E.6 we find that males work more hours per week than females, on average, and in Exercise E.9 we find
Answer the following questions using EmployedACS, a subset of ACS that only includes people who are employed.(a) Construct a graph to visualize the relationship between HoursWk and Income. Comment on
(a) Use the ACS dataset to create a plot for the overall age distribution in the US, and comment on the distribution.(b) Give and interpret a 95% confidence interval for the average age of a US
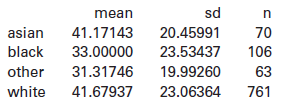
Of the n = 1000 people in ACS, 761 are White, 106 are Black, 70 are Asian, and 63 are other races. The sample proportion of people who have health insurance for each racial group are p̂white =
The dataset Employed ACS contains just the subset of people in the dataset ACS who were employed (n = 431), and includes HoursWk, the usual number of hours worked per week in the past 12 months.(a)
The Married variable in ACS codes whether each respondent is married (1) or not (0).(a) In the ACS dataset, there are 825 people who are 15 years of age or older, and p̂ = 0.53 of these people are
In our sample of 1000 people, 861 have health insurance and 139 do not.(a) Use bootstrapping to generate a 90% confidence interval for the proportion of US residents who do not have health
The US Census Bureau provides a document to assist people with statistical inference using the data from the American Community Survey. Below is an excerpt from this document. Use the information
Daniel Webster, a first-term Republican congressman from Florida, sponsored the relevant legislation to eliminate the American Community Survey. Part of his reasoning was that ‘‘. . .this is not
The GRE (Graduate Record Exam) is like the SAT exam except it is used for application to graduate school instead of college. The mean GRE scores for all examinees tested between July 1, 2006, and
Data 2.4 on page 68 introduces the dataset FloridaLakes and discusses the correlation between the acidity (pH) for a sample of n = 53 Florida lakes and the average mercury level (ppm) found in fish
Table C.1 shows a two-way table for Servers A, B, and C and for whether a credit/debit card or cash was used for payment (yes for a credit or debit card, no for cash). Do the data in the table
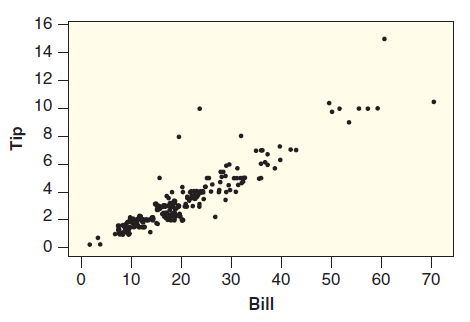
Use the information in Table C.1 to compute and interpret a 95% confidence interval for the proportion of bills paid with a credit card.Table C.1Refer to the dataset RestaurantTips. The data were
Use the information in Table C.1 to determine whether the sample provides evidence of a difference between Servers B and C in the proportion of bills paid with cash.Table C.1Refer to the dataset
Table C.2 gives summary statistics for the tip percentage based on whether or not a credit card was used. In the sample, which method of payment has a larger average tip percent? Which method has
Table C.3 gives summary statistics for the size of the bill based on whether or not a credit card was used. In the sample, which method of payment was used for larger bills? Which method has more
Studies suggest that when people mentally rehearse a physical action, they engage similar neural and cognitive operations as when they actually perform the action. Because of this, mental imaging can
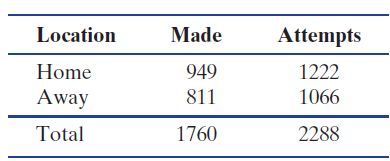
Assume that the mean number of free throws attempted by teams in all NBA games is 25.0 (based on a very large number of games over the past 10 years).The data in Miami- Heat contains information from
Assume that the proportion of free throws made by all NBA players is about 0.756 (based on many free throw attempts over a 10 year period).The data in Miami- Heat contains information from 82 regular
In Example C.4 on page 442 we see that the Heat tends to get more free throw attempts (on average) when playing games at home than on the road. Does this advantage also extend to their ability to
How many more (or fewer) successful free throw points do the Heat tend to make (on average) at home games compared to their road games?The data in Miami- Heat contains information from 82 regular
Data 2.3 on page 66 describes a dataset about patients being admitted to an Intensive Care Unit at a large hospital. We use the patients for whom information is available as a sample from the
Data 2.11 on page 111 describes a dataset that gives nutrient levels in people’s blood as well as information about their eating habits. We use the people for whom information is available as a
(a) The area below z = −2.10(b) The area above z = 1.25Find the specified areas for a N(0, 1) density.
(a) The area below z = 1.68(b) The area above z = 2.60Find the specified areas for a N(0, 1) density.
(a) The area to the left of the endpoint is about 0.60.(b) The area to the left of the endpoint is about 0.02.Find endpoint(s) on a N(0, 1) density with the given property.
(a) The area to the left of the endpoint is about 0.25.(b) The area to the right of the endpoint is about 0.08.Find endpoint(s) on a N(0, 1) density with the given property.
Find endpoints of a t-distribution with 5% beyond them in each tail if the sample has size n = 25.Assume the sample is a random sample from a distribution that is reasonably normally distributed and
Find endpoints of a t-distribution with 1% beyond them in each tail if the sample has size n = 12.Assume the sample is a random sample from a distribution that is reasonably normally distributed and
Find the area in a t-distribution to the right of 2.75 if the sample has size n = 10.Assume the sample is a random sample from a distribution that is reasonably normally distributed and we are doing
Find the area in a t-distribution to the left of −1.50 if the sample has size n = 24.Assume the sample is a random sample from a distribution that is reasonably normally distributed and we are
The NutritionStudy dataset includes a variable indicating the number of grams of fiber consumed per day by the participants. In the sample, the mean is 12.79 grams and the standard error for such
Phone A recent study shows that 17% of a random sample of 1954 cell phone owners do most of their online browsing on their phone. The standard error for the proportion is 0.0085. The sample size is
A standardized test statistic is given for a hypothesis test involving proportions (using the standard normal distribution) or means (using the t-distribution and assuming a relatively large sample
Use data collected at a retail store to estimate the average amount of money people spend in the store.Identify the method of analysis needed to answer the question. Indicate whether we should
Use results collected at a supermarket to see whether there is a difference in the average amount of time customers have to wait in line between two different check-out cashiers.Identify the method
Use data from an experiment on mice to see if there is evidence that mice fed a high-sugar diet are more likely to be classified as insulin-resistant than mice fed a normal diet.Identify the method
Showing 1 - 100
of 2109
1
2
3
4
5
6
7
8
9
10
11
12
13
14
15
Last