Question:
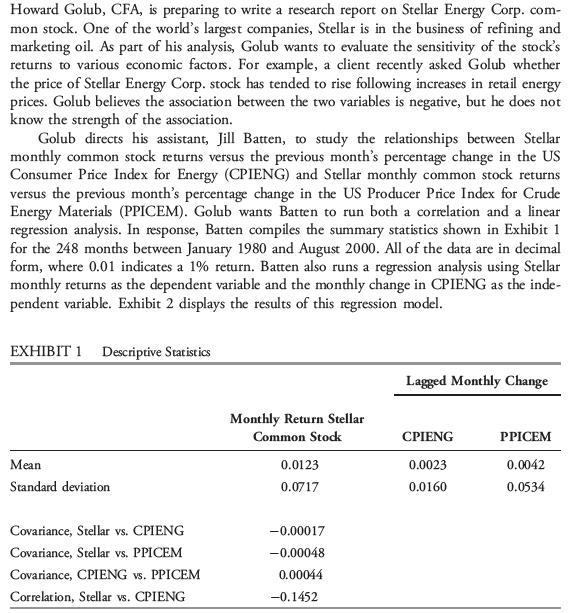
11. Based on the regression, which used data in decimal form, if the CPIENG decreases by 1.0 percent, what is the expected return on Stellar common stock during the next period?
A. 0.0073 (0.73%)
B. 0.0138 (1.38%)
C. 0.0203 (2.03%)

Transcribed Image Text:
Howard Golub, CFA, is preparing to write a research report on Stellar Energy Corp. com- mon stock. One of the world's largest companies, Stellar is in the business of refining and marketing oil. As part of his analysis, Golub wants to evaluate the sensitivity of the stock's returns to various economic factors. For example, a client recently asked Golub whether the price of Stellar Energy Corp. stock has tended to rise following increases in retail energy prices. Golub believes the association between the two variables is negative, but he does not know the strength of the association. Golub directs his assistant, Jill Batten, to study the relationships between Stellar monthly common stock returns versus the previous month's percentage change in the US Consumer Price Index for Energy (CPIENG) and Stellar monthly common stock returns versus the previous month's percentage change in the US Producer Price Index for Crude Energy Materials (PPICEM). Golub wants Batten to run both a correlation and a linear regression analysis. In response, Batten compiles the summary statistics shown in Exhibit 1 for the 248 months between January 1980 and August 2000. All of the data are in decimal form, where 0.01 indicates a 1% return. Batten also runs a regression analysis using Stellar monthly returns as the dependent variable and the monthly change in CPIENG as the inde- pendent variable. Exhibit 2 displays the results of this regression model. EXHIBIT 1 Descriptive Statistics Mean Standard deviation Lagged Monthly Change Monthly Return Stellar Common Stock CPIENG PPICEM 0.0123 0.0023 0.0042 0.0717 0.0160 0.0534 Covariance, Stellar vs. CPIENG -0.00017 Covariance, Stellar vs. PPICEM -0.00048 Covariance, CPIENG vs. PPICEM 0.00044 Correlation, Stellar vs. CPIENG -0.1452


