15. Based on Exhibits 1 and 2, if Liu were to graph the 50 observations, the scatter...
Question:
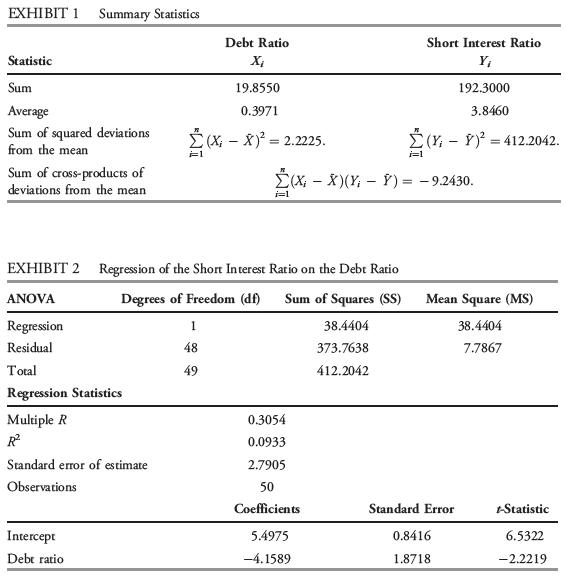
15. Based on Exhibits 1 and 2, if Liu were to graph the 50 observations, the scatter plot summarizing this relation would be best described as:
A. horizontal.
B. upward sloping.
C. downward sloping.
Anh Liu is an analyst researching whether a company’s debt burden affects investors’ decision to short the company’s stock. She calculates the short interest ratio (the ratio of short interest to average daily share volume, expressed in days) for 50 companies as of the end of 2016 and compares this ratio with the companies’ debt ratio (the ratio of total liabilities to total assets, expressed in decimal form).
Liu provides a number of statistics in Exhibit 1. She also estimates a simple regression to investigate the effect of the debt ratio on a company’s short interest ratio. The results of this simple regression, including the analysis of variance (ANOVA), are shown in Exhibit 2.
In addition to estimating a regression equation, Liu graphs the 50 observations using a scatter plot, with the short interest ratio on the vertical axis and the debt ratio on the horizontal axis.


Step by Step Answer:


