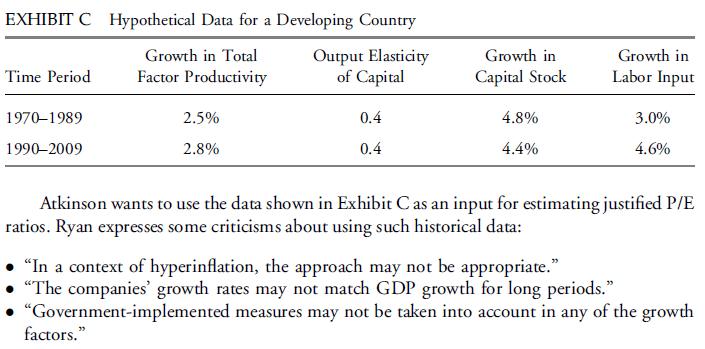
Based on Exhibit C, which of the components of economic growth has contributed most to GDP growth
Question:
Based on Exhibit C, which of the components of economic growth has contributed most to GDP growth during the 1970–1989 time period?
A. Labor input.
B. Capital stock.
C. Total factor productivity.
Use the following information to answer Question.
Claudia Atkinson, CFA, is chief economist of an investment management firm. In analyzing equity markets, the firm has always used a bottom-up approach but now Atkinson is in the process of implementing a top-down approach. She is discussing this topic with her assistant, Nicholas Ryan.
At Atkinson’s request, Ryan has prepared a memo comparing the top-down approach and the bottom-up approach. Ryan presents three conclusions:
Conclusion 1: The top-down approach is less optimistic when the economy is heading into a recession than the bottom-up approach.
Conclusion 2: The top-down approach is more often based on consensus earnings estimates from equity analysts than the bottom-up approach.
Conclusion 3: The top-down approach is often more accurate in predicting the effect on the stock market of a contemporaneous change in a key economic variable than is the bottom-up approach.
Atkinson explains to Ryan how the Cobb-Douglas function can be used to model GDP growth under assumptions of constant returns to scale. For illustrative purposes, she uses the data shown in Exhibit C.
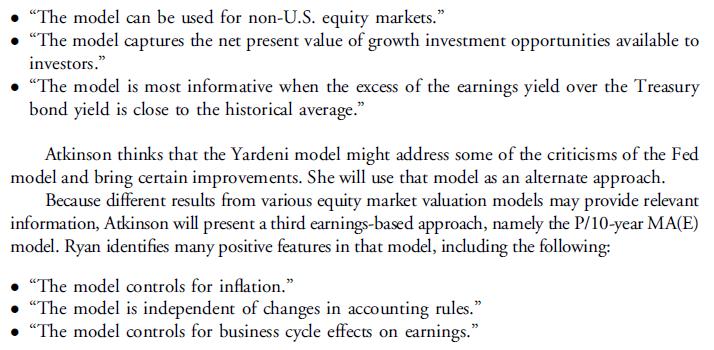
Atkinson intends to use relative value models in order to support the firm’s asset allocation recommendation. The earnings-based approach that she studies is the Fed model. She asks Ryan to write a summary of the advantages of that model. Ryan’s report makes the following assertions about the Fed model:
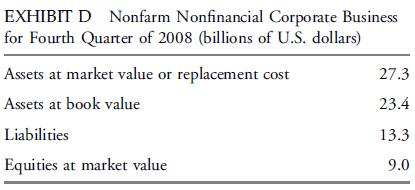
When evaluating the equity market in the United States, Atkinson uses the following asset-based models: Tobin’s q ratio and equity q ratio. She calculates the equity q ratio of Nonfarm Nonfinancial Corporate Business based on the Federal Reserve data shown in Exhibit D.
Atkinson notes that the Tobin’s q ratio that could be derived from Exhibit D is less than 1.
She asks Ryan what conclusion could be drawn from such a low ratio if it had been obtained for a specific company.
Step by Step Answer:

Investments Principles Of Portfolio And Equity Analysis
ISBN: 9780470915806
1st Edition
Authors: Michael McMillan, Jerald E. Pinto, Wendy L. Pirie, Gerhard Van De Venter, Lawrence E. Kochard


