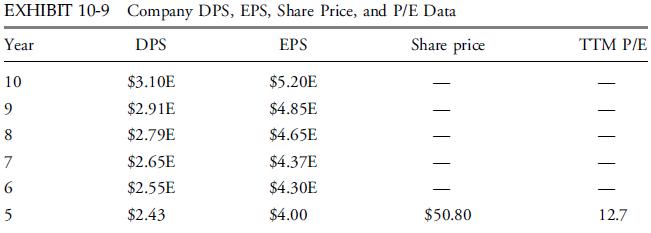
Company data for dividend per share (DPS), earnings per share (EPS), share price, and price-to-earnings ratio (P/E)
Question:
Company data for dividend per share (DPS), earnings per share (EPS), share price, and price-to-earnings ratio (P/E) for the most recent five years are presented in Exhibit 10-9.
In addition, estimates (indicated by an “E” after the amount) of DPS and EPS for the next five years are shown. The valuation date is at the end of Year 5. The company has 1,000 shares outstanding.

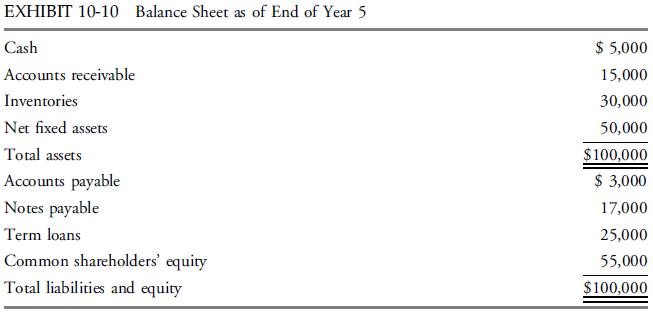
The company’s balance sheet at the end of Year 5 is given in Exhibit 10-10.
1. Using a Gordon growth model, estimate intrinsic value. Use a discount rate of 10 percent and an estimate of growth based on growth in dividends over the next five years.
2. Using a multiplier approach, estimate intrinsic value. Assume that a reasonable estimate of P/E is the average trailing twelve-month (TTM) P/E ratio over Years 1 through 4.
3. Using an asset-based valuation approach, estimate value per share from adjusted book values. Assume that the market values of accounts receivable and inventories are as reported, the market value of net fixed assets is 110 percent of reported book value, and the reported book values of liabilities reflect their market values.
Step by Step Answer:

Investments Principles Of Portfolio And Equity Analysis
ISBN: 9780470915806
1st Edition
Authors: Michael McMillan, Jerald E. Pinto, Wendy L. Pirie, Gerhard Van De Venter, Lawrence E. Kochard


