Using the same data as Example 7-7, lets consider portfolio risk. Recall that the correlation coefficient between
Question:
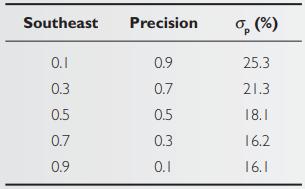
Using the same data as Example 7-7, let’s consider portfolio risk. Recall that the correlation coefficient between Southeast Utilities and Precision Instruments is +0.29. For illustration purposes, we examine five different sets of weights, each of which must sum to 1.0.

In this two‐stock portfolio example, holding the correlation coefficient constant at +0.29, the risk of the portfolio varies as the weight for each of the assets changes. Because Southeast has a substantially lower standard deviation than does Precision, portfolio risk decreases as the weight assigned to Southeast increases. However, with a positive correlation, portfolio risk reduction is somewhat limited.
Example 7-7
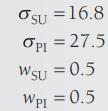
The correlation between Southeast Utilities and Precision Instruments returns is +0.29. In order to focus on the efficient, we continue to assume weights of 0.5 each—50 percent is placed in each security. Summarizing the data in this example,

With these data, the standard deviation (risk) for this portfolio,
![Op = [(0.5) (16.8) + (0.5) (27.5) +2(0.5)(0.5) (16.8) (27.5)p]/ = [70.56 + 189.06 +229.32p]/](https://dsd5zvtm8ll6.cloudfront.net/images/question_images/1703/4/0/2/4686587dbe44eeb91703402465738.jpg)
since 2(0.5)(0.5)(16.8)(27.5) = 229.32.
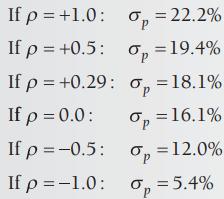
The risk of this portfolio clearly depends heavily on the value of the third term, which in turn depends on the correlation coefficient between the returns for SU and PI. To assess the potential impact of the correlation, consider the following cases: a ρ of +1, +0.5, +0.29, 0, −0.5, and −1.0. Calculating portfolio risk under each of these scenarios produces the following portfolio risks:

These calculations clearly show the impact that combining securities with less than perfect positive correlation has on portfolio risk. The risk of the portfolio steadily decreases from 22.2 percent to 5.4 percent as the correlation coefficient declines from +1.0 to −1.0. Note, however, that risk declines from 22.2 percent to only 16.1 percent as the correlation coefficient drops from +1 to 0 and it is only cut in half (approximately) when is −0.5.
Step by Step Answer:

Investments Analysis And Management
ISBN: 9781118975589
13th Edition
Authors: Charles P. Jones, Gerald R. Jensen


