Breaking the link between money growth and inflation in the medium run The money demand relationship in
Question:
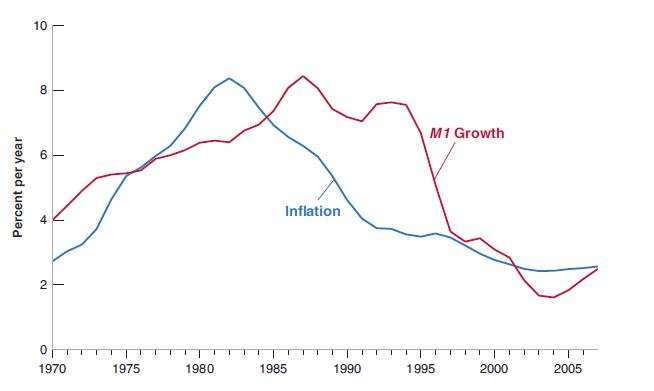
Breaking the link between money growth and inflation in the medium run The money demand relationship in Chapter 4 is used implicitly in Figure 23-1. That relation is
\[
\frac{M}{P}=Y L(i)
\]
The central bank in conjunction with the political authorities chooses an inflation target \(\pi^{*}\).
a. Derive the target nominal interest rate in a medium-run equilibrium.
b. Consider medium run equilibria where potential output does not grow. Derive the relation between money growth and inflation. Explain.
c. Now consider medium run equilibria where potential output grows at 3\% per year. Now derive the relation between money growth and inflation. Do you expect inflation to be higher or lower than money growth? Explain.
d. Consider Figure 23-1. Look first at the period ending in roughly 1995. How do your results in parts
(b) and
(c) relate to it?
Figure 23-1

e. Focus on the case where all money is currency. We can then think of money demand as being the demand for currency (you can refer back to the appendix to Chapter 4 if needed). Over the past 50 years:
i. Automatic tellers have allowed cash to be dispensed outside of regular banking hours.
ii. The use of credit cards for purchases has greatly expanded.
iii. The use of debit cards for purchases has greatly expanded.
iv. Most recently, technology has allowed for small purchases by credit and debit cards by waving the card over a payment terminal near the cash register.
How would each of these innovations affect the demand for currency?
f. The FRED database at the Federal Reserve Bank of St. Louis has a series for currency (MBCURRCIR). Download this series and the series for nominal GDP (GDP). Construct a ratio of currency to nominal GDP. How does this series behave from 1980 to 2015? Are you surprised? Who else besides households and firms holds U.S. currency?
Step by Step Answer:


