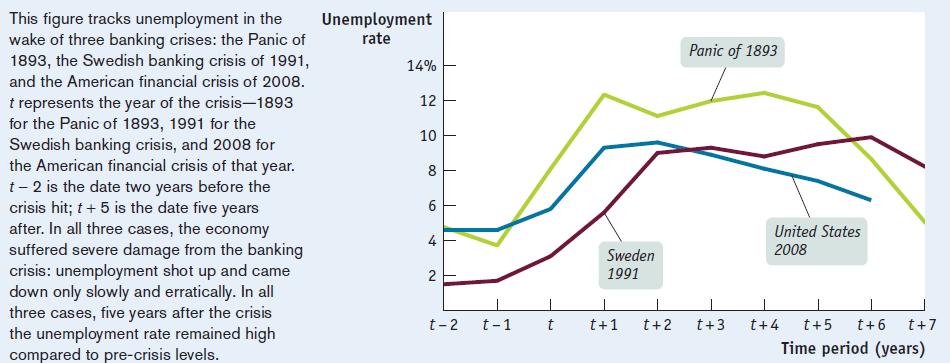
Figure 17-2 tracks the unemployment rate in the years before and after the Panic of 1893 in
Question:
Figure 17-2 tracks the unemployment rate in the years before and after the Panic of 1893 in the United States, the banking crisis of 1991 in Sweden, and the American financial crisis of 2008.
a. In Figure 17-2, how many years after the Panic of 1893 did unemployment peak in the United States?
b. In Figure 17-2, how many years after the banking crisis of 1991 did unemployment peak in Sweden?
c. In Figure 17-2, how many years after the banking crisis of 2008 did unemployment peak in the United States?
Figure 17-2
Fantastic news! We've Found the answer you've been seeking!
Step by Step Answer:
Related Book For 

Question Posted:


