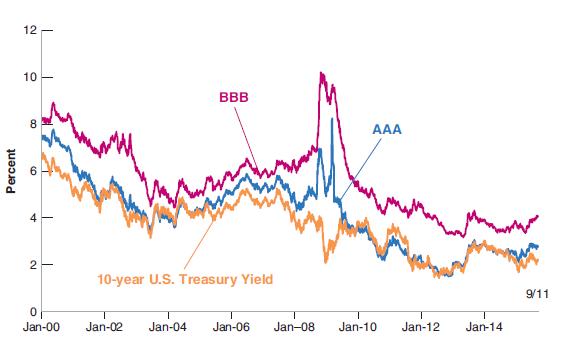
The spread between riskless and risky bonds The text used Figure 6-3 to describe fluctuations in the
Question:
The spread between riskless and risky bonds The text used Figure 6-3 to describe fluctuations in the spreads between riskless rate on 10-year U.S. Treasury bonds and 10-year \(A A A\) and BBB corporate bonds. This figure can be updated by going to the Federal Reserve Bank of St. Louis FRED data base. The 10-year Treasury bond yield is variable DGS10. Moody's 10-year seasoned AAA bond is series DAAA. Finally, the Bank of America BBB bond yield is series BAMLCOA4CBBBEY.
Figure 6-3

a. Find the values of these three yields for the day closest to the day you are looking at this question. Which is the highest yield and which is the lowest yield? What is the spread between the BBB and AAA yield? What is the spread between the BBB and AAA yield?
b. Now go back one calendar year and find the same yields and calculate the spreads. You could fill in the table below:

c. Do you see any evidence of a change in the risk premium over the past year or has it been relatively stable? Explain.
Step by Step Answer:


