Question:
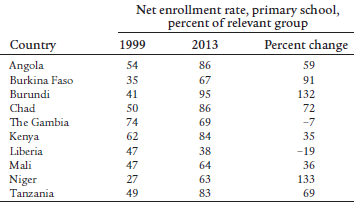
As the text states, investment in human capital is an important ingredient for a nations economic growth. The data in the following table shows the net enrollment rates in primary school as a percentage of the relevant group for 10 developing countries in 1999 and 2013. Go to http://data.worldbank.org and look up per capita GDP for these 10 countries for 1999 and 2013. (Search for GDP per capita [current $US] data.) Calculate the percent changes in per capita GDP from 1999 to 2013 for these 10 countries. Do the changes in per capita GDP seem to correlate with the changes in enrollment rates? What besides increased enrollment may be responsible for the changes in per capita GDP?
Transcribed Image Text:
Net enrollment rate, primary school, percent of relevant group Percent change Country 1999 2013 Angola Burkina Faso 54 86 59 35 67 91 41 Burundi 95 132 Chad 50 86 72 The Gambia 74 69 -7 62 35 Kenya 84 Liberia 47 38 -19 64 63 Mali 47 36 Niger 27 133 83 69 Tanzania 49